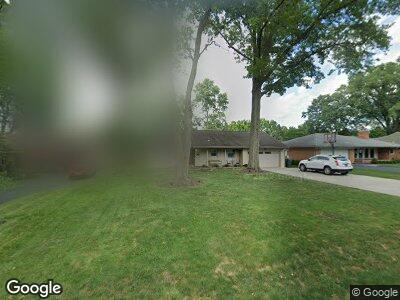
306 Charleston Ave Columbus, OH 43214
Clintonville NeighborhoodEstimated Value: $407,000 - $464,000
3
Beds
2
Baths
1,854
Sq Ft
$236/Sq Ft
Est. Value
About This Home
This home is located at 306 Charleston Ave, Columbus, OH 43214 and is currently estimated at $436,850, approximately $235 per square foot. 306 Charleston Ave is a home located in Franklin County with nearby schools including Salem Elementary School, Dominion Middle School, and Whetstone High School.
Ownership History
Date
Name
Owned For
Owner Type
Purchase Details
Closed on
Jun 1, 1998
Sold by
Arnold Philip J and Arnold Marjorie C
Bought by
Coleman Brett W and Phillips Coleman Amy
Current Estimated Value
Home Financials for this Owner
Home Financials are based on the most recent Mortgage that was taken out on this home.
Original Mortgage
$132,000
Interest Rate
7.27%
Purchase Details
Closed on
Mar 18, 1992
Purchase Details
Closed on
Sep 4, 1990
Create a Home Valuation Report for This Property
The Home Valuation Report is an in-depth analysis detailing your home's value as well as a comparison with similar homes in the area
Home Values in the Area
Average Home Value in this Area
Purchase History
| Date | Buyer | Sale Price | Title Company |
|---|---|---|---|
| Coleman Brett W | $165,000 | Celtic Title Agency Inc | |
| -- | $131,500 | -- | |
| -- | $60,000 | -- |
Source: Public Records
Mortgage History
| Date | Status | Borrower | Loan Amount |
|---|---|---|---|
| Open | Coleman Brett W | $350,000 | |
| Closed | Coleman Brett | $345,000 | |
| Closed | Coleman Brett W | $197,200 | |
| Closed | Coleman Brett W | $118,000 | |
| Closed | Coleman Brett W | $152,000 | |
| Closed | Coleman Brett W | $50,000 | |
| Closed | Coleman Brett W | $163,000 | |
| Closed | Coleman Brett W | $176,000 | |
| Closed | Coleman Brett W | $39,558 | |
| Closed | Coleman Brett W | $178,000 | |
| Closed | Coleman Brett W | $75,000 | |
| Closed | Coleman Brett W | $125,303 | |
| Closed | Colemanand Brett W | $127,000 | |
| Closed | Coleman Brett W | $44,500 | |
| Closed | Coleman Brett W | $132,000 |
Source: Public Records
Tax History Compared to Growth
Tax History
| Year | Tax Paid | Tax Assessment Tax Assessment Total Assessment is a certain percentage of the fair market value that is determined by local assessors to be the total taxable value of land and additions on the property. | Land | Improvement |
|---|---|---|---|---|
| 2024 | $6,306 | $140,500 | $37,700 | $102,800 |
| 2023 | $6,225 | $140,500 | $37,700 | $102,800 |
| 2022 | $6,368 | $122,790 | $26,640 | $96,150 |
| 2021 | $6,380 | $122,790 | $26,640 | $96,150 |
| 2020 | $6,388 | $122,790 | $26,640 | $96,150 |
| 2019 | $5,636 | $92,900 | $20,480 | $72,420 |
| 2018 | $5,160 | $92,900 | $20,480 | $72,420 |
| 2017 | $5,632 | $92,900 | $20,480 | $72,420 |
| 2016 | $5,173 | $78,090 | $18,620 | $59,470 |
| 2015 | $4,696 | $78,090 | $18,620 | $59,470 |
| 2014 | $4,707 | $78,090 | $18,620 | $59,470 |
| 2013 | $2,211 | $74,375 | $17,745 | $56,630 |
Source: Public Records
Map
Nearby Homes
- 316 Charleston Ave
- 5308 Sharon Ave
- 220 E Kanawha Ave
- 205 Meadowlark Ln
- 471 Chase Rd
- 578 Glenridge Place
- 114 Chase Rd
- 587 Center Woods Dr
- 62 Rosslyn Ave
- 5765 Granby St
- 220 Hardy Way
- 109 Sharon Springs Dr
- 4825 Sharon Ave
- 224 Morse Rd
- 128 Chaucer Ct
- 166 E Jeffrey Place
- 234 Rosslyn Ave
- 494 Park Overlook Dr
- 37 Morse Rd
- 5290 Crawford Dr
- 306 Charleston Ave
- 296 Charleston Ave
- 313 Meadowlark Ln
- 321 Meadowlark Ln
- 305 Meadowlark Ln
- 326 Charleston Ave
- 288 Charleston Ave
- 329 Meadowlark Ln
- 297 Meadowlark Ln
- 317 Charleston Ave
- 336 Charleston Ave
- 299 Charleston Ave
- 337 Meadowlark Ln
- 289 Meadowlark Ln
- 274 Charleston Ave
- 331 Charleston Ave
- 287 Charleston Ave
- 345 Meadowlark Ln
- 346 Charleston Ave
- 339 Charleston Ave