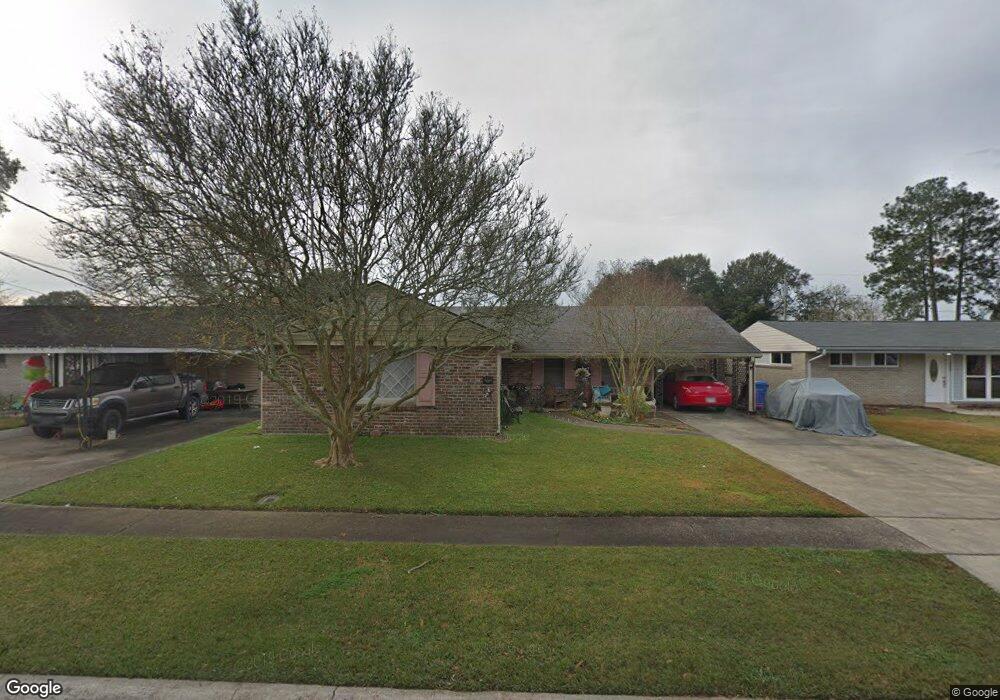
308 Talbot Dr Luling, LA 70070
Estimated Value: $206,693 - $249,000
Studio
--
Bath
1,996
Sq Ft
$117/Sq Ft
Est. Value
About This Home
This home is located at 308 Talbot Dr, Luling, LA 70070 and is currently estimated at $232,673, approximately $116 per square foot. 308 Talbot Dr is a home located in St. Charles Parish with nearby schools including Luling Elementary School, R.K. Smith Middle School, and Hahnville High School.
Ownership History
Date
Name
Owned For
Owner Type
Purchase Details
Closed on
Sep 22, 2017
Sold by
Weston Thomas
Bought by
Weston Amy Cavallo
Current Estimated Value
Home Financials for this Owner
Home Financials are based on the most recent Mortgage that was taken out on this home.
Original Mortgage
$156,135
Outstanding Balance
$129,917
Interest Rate
4.12%
Mortgage Type
FHA
Estimated Equity
$102,756
Purchase Details
Closed on
Jul 3, 2007
Sold by
Johnson Gregory T
Bought by
Weston Thomas
Home Financials for this Owner
Home Financials are based on the most recent Mortgage that was taken out on this home.
Original Mortgage
$175,000
Interest Rate
6.37%
Mortgage Type
New Conventional
Create a Home Valuation Report for This Property
The Home Valuation Report is an in-depth analysis detailing your home's value as well as a comparison with similar homes in the area
Home Values in the Area
Average Home Value in this Area
Purchase History
| Date | Buyer | Sale Price | Title Company |
|---|---|---|---|
| Weston Amy Cavallo | -- | Homestead Title Cop | |
| Weston Thomas | -- | Homestead Title Corp |
Source: Public Records
Mortgage History
| Date | Status | Borrower | Loan Amount |
|---|---|---|---|
| Open | Weston Amy Cavallo | $156,135 | |
| Closed | Weston Thomas | $175,000 |
Source: Public Records
Tax History
| Year | Tax Paid | Tax Assessment Tax Assessment Total Assessment is a certain percentage of the fair market value that is determined by local assessors to be the total taxable value of land and additions on the property. | Land | Improvement |
|---|---|---|---|---|
| 2025 | $969 | $17,090 | $2,350 | $14,740 |
| 2024 | $969 | $17,090 | $2,350 | $14,740 |
| 2023 | $984 | $15,185 | $2,610 | $12,575 |
| 2022 | $899 | $15,185 | $2,610 | $12,575 |
| 2021 | $460 | $11,403 | $2,349 | $9,054 |
| 2020 | $1,794 | $15,185 | $2,610 | $12,575 |
| 2019 | $1,598 | $13,478 | $2,500 | $10,978 |
| 2018 | $1,586 | $13,478 | $2,500 | $10,978 |
| 2017 | $1,584 | $13,478 | $2,500 | $10,978 |
| 2016 | $1,591 | $13,478 | $2,500 | $10,978 |
| 2015 | $764 | $14,000 | $1,044 | $12,956 |
| 2014 | $736 | $14,000 | $1,044 | $12,956 |
| 2013 | $739 | $14,000 | $1,044 | $12,956 |
Source: Public Records
Map
Nearby Homes
Your Personal Tour Guide
Ask me questions while you tour the home.