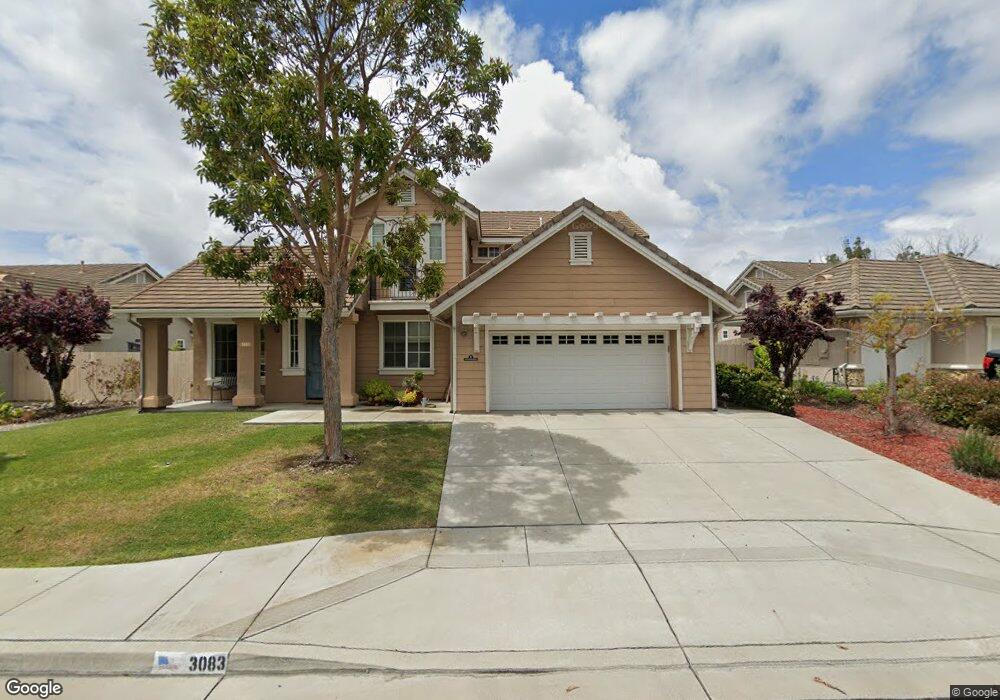
3083 Buckthorn Ln Lompoc, CA 93436
Mission Hills NeighborhoodEstimated Value: $944,101 - $1,063,000
6
Beds
3
Baths
3,599
Sq Ft
$280/Sq Ft
Est. Value
About This Home
This home is located at 3083 Buckthorn Ln, Lompoc, CA 93436 and is currently estimated at $1,007,775, approximately $280 per square foot. 3083 Buckthorn Ln is a home located in Santa Barbara County with nearby schools including Los Berros Visual and Performing Arts Academy, Cabrillo High School, and Olive Grove Charter - Lompoc.
Ownership History
Date
Name
Owned For
Owner Type
Purchase Details
Closed on
Mar 12, 2024
Sold by
Baumgardner James
Bought by
Baumgardner Family Trust and Baumgardner
Current Estimated Value
Purchase Details
Closed on
Nov 19, 2013
Sold by
Sleigh Dean M and Sleigh Jeanie M
Bought by
Baumgardner James and Baumgardner Antoinette
Home Financials for this Owner
Home Financials are based on the most recent Mortgage that was taken out on this home.
Original Mortgage
$402,912
Interest Rate
4.23%
Mortgage Type
VA
Purchase Details
Closed on
Dec 29, 2004
Sold by
Harris Grade Lp
Bought by
Sleigh Dean M and Sleigh Jeanie M
Home Financials for this Owner
Home Financials are based on the most recent Mortgage that was taken out on this home.
Original Mortgage
$551,000
Interest Rate
5.75%
Mortgage Type
New Conventional
Create a Home Valuation Report for This Property
The Home Valuation Report is an in-depth analysis detailing your home's value as well as a comparison with similar homes in the area
Home Values in the Area
Average Home Value in this Area
Purchase History
| Date | Buyer | Sale Price | Title Company |
|---|---|---|---|
| Baumgardner Family Trust | -- | None Listed On Document | |
| Baumgardner James | $441,500 | First American Title Company | |
| Sleigh Dean M | $689,000 | First American Title Company |
Source: Public Records
Mortgage History
| Date | Status | Borrower | Loan Amount |
|---|---|---|---|
| Previous Owner | Baumgardner James | $402,912 | |
| Previous Owner | Sleigh Dean M | $68,900 | |
| Previous Owner | Sleigh Dean M | $551,000 |
Source: Public Records
Tax History Compared to Growth
Tax History
| Year | Tax Paid | Tax Assessment Tax Assessment Total Assessment is a certain percentage of the fair market value that is determined by local assessors to be the total taxable value of land and additions on the property. | Land | Improvement |
|---|---|---|---|---|
| 2025 | $5,840 | $541,208 | $153,227 | $387,981 |
| 2023 | $5,840 | $520,194 | $147,278 | $372,916 |
| 2022 | $5,743 | $509,995 | $144,391 | $365,604 |
| 2021 | $5,811 | $499,996 | $141,560 | $358,436 |
| 2020 | $5,748 | $494,870 | $140,109 | $354,761 |
| 2019 | $5,655 | $485,167 | $137,362 | $347,805 |
| 2018 | $5,569 | $475,655 | $134,669 | $340,986 |
| 2017 | $5,469 | $466,329 | $132,029 | $334,300 |
| 2016 | $5,371 | $457,187 | $129,441 | $327,746 |
| 2014 | $5,257 | $441,500 | $125,000 | $316,500 |
Source: Public Records
Map
Nearby Homes
- 757 Onstott Rd
- 3030 Silver Sage Ln
- 3010 Silver Sage Ln
- 832 Onstott Rd
- 3146 Manley Dr
- 778 Tamarisk Dr
- 2611 N Highway 1
- 3333 Courtney Dr
- 3118 Pellham Dr
- 1320 Onstott Rd
- 3347 Via Cortez
- 3725 Jupiter Ave
- 721 Goddard Dr
- 768 Pluto Ave
- 559 Mars Ave
- 747 Carina Dr
- 1445 Calle Marana
- 744 Cagney Way
- 384 Falcon Crest Dr
- 3925 Clubhouse Ct
- 3073 Buckthorn Ln
- 3093 Buckthorn Ln
- 3082 Mesquite Ln
- 3063 Buckthorn Ln
- 3074 Buckthorn Ln
- 3084 Buckthorn Ln
- 3084 Buckthorn Ln Ln
- 3072 Mesquite Ln
- 804 Onstott Rd
- 3064 Buckthorn Ln
- 3062 Mesquite Ln
- 3053 Buckthorn Ln
- 777 Onstott Rd
- 3054 Buckthorn Ln
- 810 Onstott Rd
- 3052 Mesquite Ln
- 3044 Buckthorn Ln
- 3071 Mesquite Ln
- 3043 Buckthorn Ln