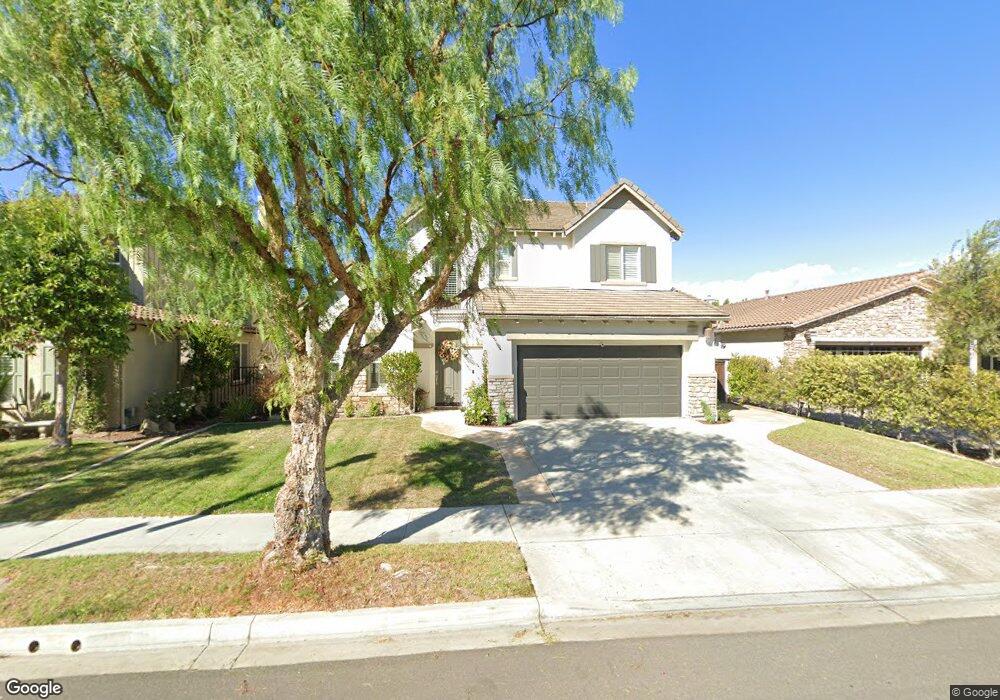
3089 Bridgehampton Way Camarillo, CA 93012
Estimated Value: $1,165,000 - $1,394,000
5
Beds
3
Baths
2,760
Sq Ft
$454/Sq Ft
Est. Value
About This Home
This home is located at 3089 Bridgehampton Way, Camarillo, CA 93012 and is currently estimated at $1,253,878, approximately $454 per square foot. 3089 Bridgehampton Way is a home located in Ventura County with nearby schools including Rancho Rosal Elementary School, Monte Vista Middle School, and Adolfo Camarillo High School.
Ownership History
Date
Name
Owned For
Owner Type
Purchase Details
Closed on
Feb 19, 2021
Sold by
Stanley Thomas Alan and Stanley Tanya Joy
Bought by
Stanley Thomas A and Stanley Tanya J
Current Estimated Value
Purchase Details
Closed on
Jul 3, 2013
Sold by
Schmidt Brian A and Schmidt Kristine A
Bought by
Stanley Thomas Alan and Stanley Tanya Joy
Home Financials for this Owner
Home Financials are based on the most recent Mortgage that was taken out on this home.
Original Mortgage
$614,495
Outstanding Balance
$446,072
Interest Rate
3.88%
Mortgage Type
VA
Estimated Equity
$807,806
Purchase Details
Closed on
Jan 10, 2006
Sold by
Western Pacific Housing Inc
Bought by
Schmidt Brian A and Schmidt Kristine A
Home Financials for this Owner
Home Financials are based on the most recent Mortgage that was taken out on this home.
Original Mortgage
$86,295
Interest Rate
5.82%
Mortgage Type
Stand Alone Second
Create a Home Valuation Report for This Property
The Home Valuation Report is an in-depth analysis detailing your home's value as well as a comparison with similar homes in the area
Home Values in the Area
Average Home Value in this Area
Purchase History
| Date | Buyer | Sale Price | Title Company |
|---|---|---|---|
| Stanley Thomas A | -- | None Available | |
| Stanley Thomas Alan | $620,000 | Equity Title Los Angeles | |
| Schmidt Brian A | $863,000 | Chicago Title Company |
Source: Public Records
Mortgage History
| Date | Status | Borrower | Loan Amount |
|---|---|---|---|
| Open | Stanley Thomas Alan | $614,495 | |
| Previous Owner | Schmidt Brian A | $86,295 | |
| Previous Owner | Schmidt Brian A | $690,364 |
Source: Public Records
Tax History
| Year | Tax Paid | Tax Assessment Tax Assessment Total Assessment is a certain percentage of the fair market value that is determined by local assessors to be the total taxable value of land and additions on the property. | Land | Improvement |
|---|---|---|---|---|
| 2025 | $8,256 | $760,023 | $304,009 | $456,014 |
| 2024 | $8,256 | $745,121 | $298,048 | $447,073 |
| 2023 | $7,958 | $730,511 | $292,204 | $438,307 |
| 2022 | $7,933 | $716,188 | $286,475 | $429,713 |
| 2021 | $7,647 | $702,146 | $280,858 | $421,288 |
| 2020 | $7,619 | $694,948 | $277,979 | $416,969 |
| 2019 | $7,584 | $681,323 | $272,529 | $408,794 |
| 2018 | $7,443 | $667,965 | $267,186 | $400,779 |
| 2017 | $7,002 | $654,869 | $261,948 | $392,921 |
| 2016 | $6,833 | $642,029 | $256,812 | $385,217 |
| 2015 | $6,761 | $632,387 | $252,955 | $379,432 |
| 2014 | $6,602 | $620,000 | $248,000 | $372,000 |
Source: Public Records
Map
Nearby Homes
- 406 Town Forest Ct
- 409 Spring Park Rd
- 259 Riverdale Ct Unit 241
- 259 Riverdale Ct Unit 263
- 288 Lightwood St Unit 114
- 2862 Via Descanso
- 533 Via Vallarta
- 537 Via Vallarta
- 539 Via Vallarta
- 541 Via Vallarta
- 551 Via Vallarta
- 553 Via Vallarta
- 555 Via Vallarta
- 559 Via Vallarta
- 302 Marlee Ln
- 2870 Via Dolomito
- 3773 Golden Pond Dr
- 62 + Calleguas
- 2764 Petit St
- 142 Via Rosal
- 3077 Bridgehampton Way
- 3095 Bridgehampton Way
- 3065 Bridgehampton Way
- 3088 White Rock Rd
- 3076 White Rock Rd
- 3064 White Rock Rd
- 3059 Bridgehampton Way
- 3058 White Rock Rd
- 420 Castleton St
- 418 Castleton St
- 3046 White Rock Rd
- 3047 Bridgehampton Way
- 410 Castleton St
- 408 Castleton St
- 3034 White Rock Rd
- 3035 Bridgehampton Way
- 3081 White Rock Rd
- 3071 White Rock Rd
- 3091 White Rock Rd
- 3061 White Rock Rd
Your Personal Tour Guide
Ask me questions while you tour the home.