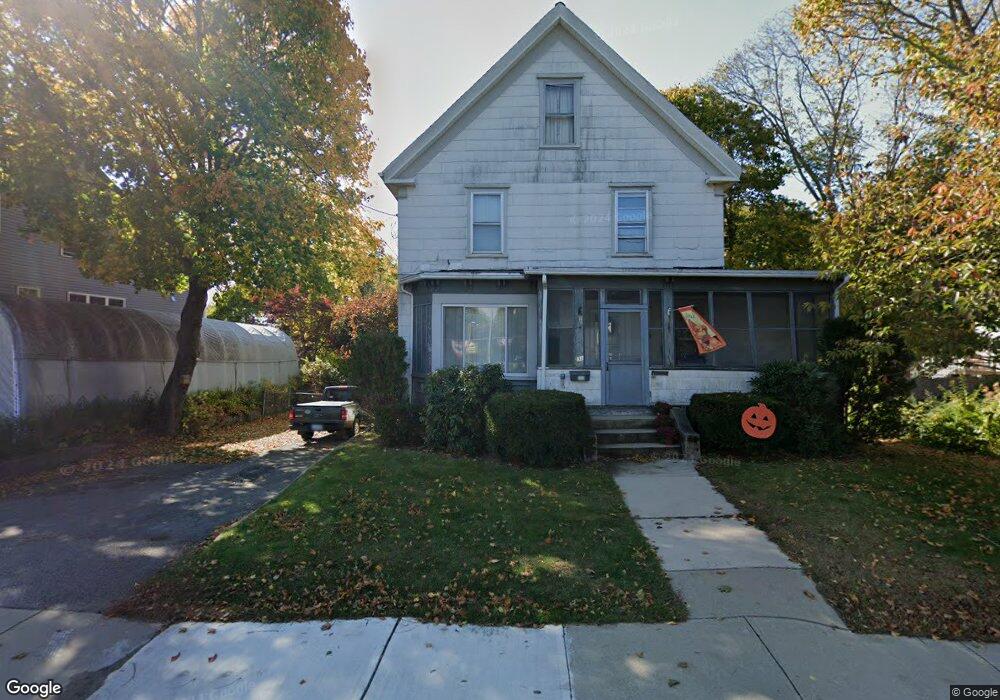
31 Peck St Franklin, MA 02038
Downtown Franklin NeighborhoodEstimated Value: $517,000 - $538,000
4
Beds
2
Baths
1,583
Sq Ft
$334/Sq Ft
Est. Value
About This Home
This home is located at 31 Peck St, Franklin, MA 02038 and is currently estimated at $529,351, approximately $334 per square foot. 31 Peck St is a home located in Norfolk County with nearby schools including Remington Middle School, Franklin High School, and Benjamin Franklin Classical Charter Public School.
Ownership History
Date
Name
Owned For
Owner Type
Purchase Details
Closed on
Jun 30, 1993
Sold by
Priesing Ralph G and Priesing Barbara J
Bought by
Oneila Thomas H and Oneil Renee T
Current Estimated Value
Home Financials for this Owner
Home Financials are based on the most recent Mortgage that was taken out on this home.
Original Mortgage
$106,800
Interest Rate
7.46%
Mortgage Type
Purchase Money Mortgage
Create a Home Valuation Report for This Property
The Home Valuation Report is an in-depth analysis detailing your home's value as well as a comparison with similar homes in the area
Home Values in the Area
Average Home Value in this Area
Purchase History
| Date | Buyer | Sale Price | Title Company |
|---|---|---|---|
| Oneila Thomas H | $112,500 | -- |
Source: Public Records
Mortgage History
| Date | Status | Borrower | Loan Amount |
|---|---|---|---|
| Open | Oneila Thomas H | $18,000 | |
| Closed | Oneila Thomas H | $18,500 | |
| Closed | Oneila Thomas H | $106,800 |
Source: Public Records
Tax History Compared to Growth
Tax History
| Year | Tax Paid | Tax Assessment Tax Assessment Total Assessment is a certain percentage of the fair market value that is determined by local assessors to be the total taxable value of land and additions on the property. | Land | Improvement |
|---|---|---|---|---|
| 2025 | $5,238 | $450,800 | $220,900 | $229,900 |
| 2024 | $4,869 | $413,000 | $220,900 | $192,100 |
| 2023 | $4,676 | $371,700 | $204,300 | $167,400 |
| 2022 | $4,662 | $331,800 | $184,100 | $147,700 |
| 2021 | $4,200 | $286,700 | $172,800 | $113,900 |
| 2020 | $4,466 | $307,800 | $199,400 | $108,400 |
| 2019 | $4,077 | $278,100 | $169,400 | $108,700 |
| 2018 | $4,008 | $273,600 | $176,100 | $97,500 |
| 2017 | $3,843 | $263,600 | $166,100 | $97,500 |
| 2016 | $3,812 | $262,900 | $179,400 | $83,500 |
| 2015 | $3,535 | $238,200 | $154,700 | $83,500 |
| 2014 | $3,085 | $213,500 | $130,000 | $83,500 |
Source: Public Records
Map
Nearby Homes
- 67 Cottage St
- 32 Dale St
- 99 Summer St
- 7 Howard Place
- 90 E Central St Unit 103
- 90 E Central St Unit 106
- 90 E Central St Unit 304
- 90 E Central St Unit 202
- 90 E Central St Unit 105
- 90 E Central St Unit 301
- 1 Pond Place
- 40 Cross St
- 374-378 Union St
- 1 Joy St
- 159 E Central St
- 417 Union St
- 76 Dean Ave
- 82 Uncas Ave Unit 1
- 120 Union St Unit 1
- 64 Uncas Ave
- 39 Peck St
- 21 Peck St
- 45 Peck St
- 999 Undisclosed
- 44 Peck St
- 13 Peck St
- 6 Cottage Ct
- 90 Cottage St
- 90 Cottage St Unit 2
- 82 Cottage St
- 66 Winter St
- 3 Cottage Ct
- 94 Cottage St
- 58 Winter St Unit 58
- 98-102 Cottage St Unit 98
- 98 Cottage St
- 56 Winter St
- 74 Cottage St Unit 5
- 74 Cottage St Unit 3
- 74 Cottage St Unit 1