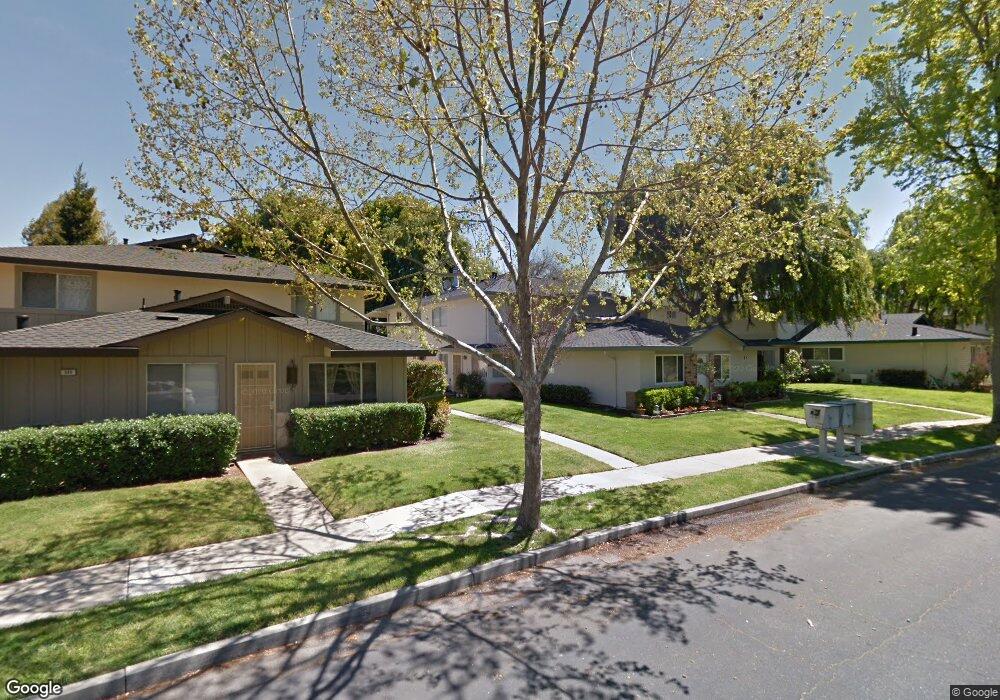
310 N 1st St Unit 4 Campbell, CA 95008
Downtown Campbell NeighborhoodEstimated Value: $594,690 - $680,000
2
Beds
1
Bath
798
Sq Ft
$810/Sq Ft
Est. Value
About This Home
This home is located at 310 N 1st St Unit 4, Campbell, CA 95008 and is currently estimated at $646,423, approximately $810 per square foot. 310 N 1st St Unit 4 is a home located in Santa Clara County with nearby schools including Rosemary Elementary School, Del Mar High School, and Campbell School of Innovation.
Ownership History
Date
Name
Owned For
Owner Type
Purchase Details
Closed on
Dec 29, 2016
Sold by
Callaway Jerry L and Callaway Sheila M Thares
Bought by
Callaway Jerry L and Thares Callaway Sheila M
Current Estimated Value
Purchase Details
Closed on
Oct 31, 2011
Sold by
Thanes Callaway Sheila Michelle
Bought by
Thanes Callaway Sheila M and Callaway Jerry L
Purchase Details
Closed on
Sep 6, 2011
Sold by
Thanes Callaway Sheila M
Bought by
Callaway Jenny L
Purchase Details
Closed on
Jun 14, 2002
Sold by
Thares Sheila M
Bought by
Thares Sheila Michelle
Create a Home Valuation Report for This Property
The Home Valuation Report is an in-depth analysis detailing your home's value as well as a comparison with similar homes in the area
Home Values in the Area
Average Home Value in this Area
Purchase History
| Date | Buyer | Sale Price | Title Company |
|---|---|---|---|
| Callaway Jerry L | -- | None Available | |
| Callaway Jerry L | -- | None Available | |
| Thanes Callaway Sheila M | -- | None Available | |
| Callaway Jenny L | -- | None Available | |
| Thares Sheila Michelle | -- | -- |
Source: Public Records
Tax History Compared to Growth
Tax History
| Year | Tax Paid | Tax Assessment Tax Assessment Total Assessment is a certain percentage of the fair market value that is determined by local assessors to be the total taxable value of land and additions on the property. | Land | Improvement |
|---|---|---|---|---|
| 2025 | $3,730 | $236,924 | $114,926 | $121,998 |
| 2024 | $3,730 | $232,279 | $112,673 | $119,606 |
| 2023 | $3,688 | $227,725 | $110,464 | $117,261 |
| 2022 | $3,722 | $223,261 | $108,299 | $114,962 |
| 2021 | $3,639 | $218,884 | $106,176 | $112,708 |
| 2020 | $3,533 | $216,641 | $105,088 | $111,553 |
| 2019 | $3,470 | $212,394 | $103,028 | $109,366 |
| 2018 | $3,358 | $208,230 | $101,008 | $107,222 |
| 2017 | $3,296 | $204,148 | $99,028 | $105,120 |
| 2016 | $3,093 | $200,146 | $97,087 | $103,059 |
| 2015 | $3,018 | $197,140 | $95,629 | $101,511 |
| 2014 | $2,848 | $193,279 | $93,756 | $99,523 |
Source: Public Records
Map
Nearby Homes
- 390 N 1st St Unit 2
- 21 N 2nd St Unit 303
- 665 Hawthorne Ave
- 411 Dunster Dr
- 238 Railway Ave
- 195 Sunnyside Ave
- 160 Quail Hollow Dr Unit 160A
- 120 Kennedy Ave
- 47 Quail Hollow Dr Unit 47
- 26 Quail Hollow Dr Unit 26
- 919 Ravenscourt Ave
- 3228 Williamsburg Dr
- 102 Quail Hollow Dr Unit 102
- 870 Camden Ave Unit 96
- 99 Timber Cove Dr Unit 99
- 1329 Essex Way
- 3264 Valley Square Ln
- 540 Valley Forge Way
- 14 Timber Cove Dr Unit 14
- 605 Corliss Way
- 310 N 1st St Unit 3
- 310 N 1st St Unit 2
- 310 N 1st St Unit 1
- 320 N 1st St Unit 4
- 320 N 1st St Unit 3
- 320 N 1st St Unit 2
- 320 N 1st St Unit 1
- 300 N 1st St Unit 4
- 300 N 1st St Unit 3
- 300 N 1st St Unit 2
- 300 N 1st St Unit 1
- 330 N 1st St Unit 4
- 330 N 1st St Unit 3
- 330 N 1st St Unit 2
- 330 N 1st St Unit 1
- 301 N Central Ave
- 291 N Central Ave
- 309 N Central Ave
- 281 N Central Ave
- 317 N Central Ave