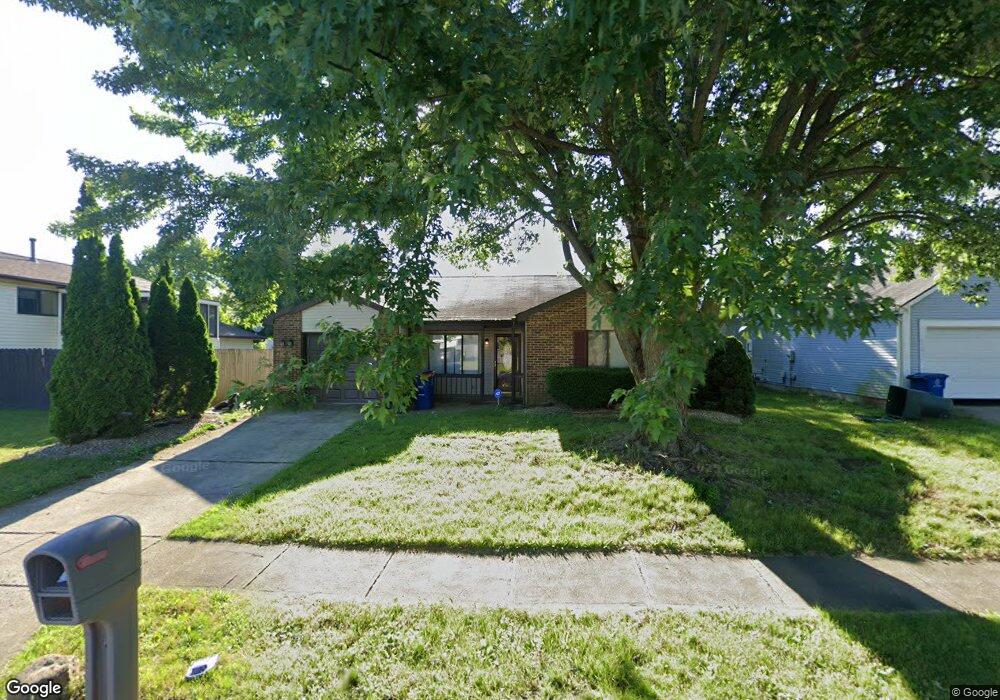
3100 Thorndyke St Columbus, OH 43232
Walnut Heights NeighborhoodEstimated Value: $198,505 - $255,000
3
Beds
1
Bath
1,102
Sq Ft
$200/Sq Ft
Est. Value
About This Home
This home is located at 3100 Thorndyke St, Columbus, OH 43232 and is currently estimated at $220,626, approximately $200 per square foot. 3100 Thorndyke St is a home located in Franklin County with nearby schools including Liberty Elementary School, Yorktown Middle School, and Independence High School.
Ownership History
Date
Name
Owned For
Owner Type
Purchase Details
Closed on
Feb 6, 2009
Sold by
Wells Fargo Bank Na
Bought by
Carley Properties Llc
Current Estimated Value
Purchase Details
Closed on
Oct 22, 2008
Sold by
Locke Kasee D and Case #08Cve03 4094
Bought by
Wells Fargo Bank Na
Purchase Details
Closed on
Aug 11, 2006
Sold by
Lassiter Laura and Lassiter Laura S
Bought by
Locke David and Locke Kasee D
Home Financials for this Owner
Home Financials are based on the most recent Mortgage that was taken out on this home.
Original Mortgage
$84,000
Interest Rate
6.75%
Mortgage Type
Stand Alone First
Purchase Details
Closed on
Sep 21, 2000
Sold by
Reiche Charles P and Reiche Regina L
Bought by
Lassiter Laura and Lassiter Laura S
Home Financials for this Owner
Home Financials are based on the most recent Mortgage that was taken out on this home.
Original Mortgage
$89,854
Interest Rate
8.05%
Mortgage Type
FHA
Purchase Details
Closed on
Apr 26, 1994
Purchase Details
Closed on
Mar 11, 1987
Create a Home Valuation Report for This Property
The Home Valuation Report is an in-depth analysis detailing your home's value as well as a comparison with similar homes in the area
Home Values in the Area
Average Home Value in this Area
Purchase History
| Date | Buyer | Sale Price | Title Company |
|---|---|---|---|
| Carley Properties Llc | $42,000 | Attorney | |
| Wells Fargo Bank Na | $70,000 | None Available | |
| Locke David | $105,000 | 21St Centu | |
| Lassiter Laura | $89,900 | Hummel Title Agency Inc | |
| -- | -- | -- | |
| -- | $54,200 | -- |
Source: Public Records
Mortgage History
| Date | Status | Borrower | Loan Amount |
|---|---|---|---|
| Previous Owner | Locke David | $84,000 | |
| Previous Owner | Lassiter Laura | $89,854 |
Source: Public Records
Tax History Compared to Growth
Tax History
| Year | Tax Paid | Tax Assessment Tax Assessment Total Assessment is a certain percentage of the fair market value that is determined by local assessors to be the total taxable value of land and additions on the property. | Land | Improvement |
|---|---|---|---|---|
| 2024 | $2,586 | $56,430 | $17,400 | $39,030 |
| 2023 | $2,554 | $56,420 | $17,395 | $39,025 |
| 2022 | $1,463 | $27,520 | $5,780 | $21,740 |
| 2021 | $1,465 | $27,520 | $5,780 | $21,740 |
| 2020 | $1,499 | $27,520 | $5,780 | $21,740 |
| 2019 | $1,458 | $23,450 | $4,830 | $18,620 |
| 2018 | $1,264 | $23,450 | $4,830 | $18,620 |
| 2017 | $1,330 | $23,450 | $4,830 | $18,620 |
| 2016 | $1,202 | $17,330 | $5,530 | $11,800 |
| 2015 | $1,072 | $17,330 | $5,530 | $11,800 |
| 2014 | $1,075 | $17,330 | $5,530 | $11,800 |
| 2013 | $589 | $19,250 | $6,160 | $13,090 |
Source: Public Records
Map
Nearby Homes
- 5377 Bleaker Ave
- 5401 Spire Ln
- 3148 Aldgate St
- 5373 Spire Ln
- 3198 Gallant Dr
- 2998 Osgood Rd E
- 2991 Blue Moon Dr
- 3289 Kady Ln
- 5882 Abernathy Ln Unit 5882F
- 5278 Glenbriar Ct
- 2744 Barrows Rd
- 5936 Abernathy Ln
- 2736 Barrows Rd
- 2730 Raphael Dr
- 3298 Joshstock Dr
- 5938 Abernathy Ln
- 3304 Joshstock Dr
- 3310 Joshstock Dr
- 5944 Abernathy Ln
- St Martin Plan at Chatterton Commons
- 3108 Thorndyke St
- 5375 Brayton Ave
- 5383 Brayton Ave
- 3116 Thorndyke St
- 3111 Crossgate Rd
- 3101 Thorndyke St
- 3119 Crossgate Rd
- 5391 Brayton Ave
- 3122 Thorndyke St
- 3109 Thorndyke St
- 3115 Thorndyke St
- 3127 Crossgate Rd
- 5380 Brayton Ave
- 5374 Brayton Ave
- 3128 Thorndyke St
- 5368 Brayton Ave
- 5386 Brayton Ave
- 3121 Thorndyke St
- 5362 Brayton Ave
- 3135 Crossgate Rd