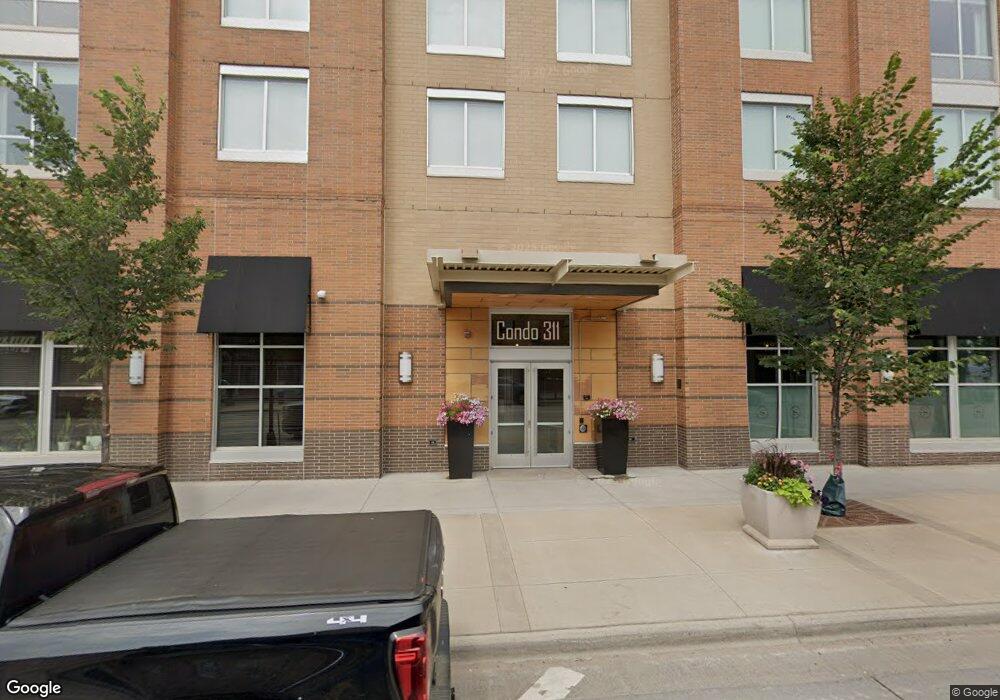
311 E Superior St Unit 903 Duluth, MN 55802
Downtown Duluth NeighborhoodEstimated Value: $578,000 - $877,000
3
Beds
2
Baths
1,750
Sq Ft
$442/Sq Ft
Est. Value
About This Home
This home is located at 311 E Superior St Unit 903, Duluth, MN 55802 and is currently estimated at $773,189, approximately $441 per square foot. 311 E Superior St Unit 903 is a home located in St. Louis County with nearby schools including Myers-Wilkins Elementary, Lincoln Park Middle School, and Denfeld High School.
Ownership History
Date
Name
Owned For
Owner Type
Purchase Details
Closed on
Nov 3, 2021
Sold by
Superior View Llc
Bought by
Winkle David and Winkle Joy
Current Estimated Value
Home Financials for this Owner
Home Financials are based on the most recent Mortgage that was taken out on this home.
Original Mortgage
$520,000
Outstanding Balance
$474,672
Interest Rate
2.87%
Mortgage Type
New Conventional
Estimated Equity
$298,517
Purchase Details
Closed on
Feb 8, 2020
Sold by
Alarcon Bustamante Gloria and Lara Angeli Felipe F
Bought by
Superiorview Llc
Purchase Details
Closed on
Sep 21, 2018
Sold by
Lara Angeli Felipe F and Alarcon Bustamante Gloria
Bought by
Alarcon Bustamante Gloria
Purchase Details
Closed on
Dec 9, 2013
Sold by
Leon Francisco Judith and Leon Francisco
Bought by
Lara Angeli Felipe F
Create a Home Valuation Report for This Property
The Home Valuation Report is an in-depth analysis detailing your home's value as well as a comparison with similar homes in the area
Home Values in the Area
Average Home Value in this Area
Purchase History
| Date | Buyer | Sale Price | Title Company |
|---|---|---|---|
| Winkle David | $662,500 | North Shore Title | |
| Superiorview Llc | -- | None Available | |
| Alarcon Bustamante Gloria | -- | None Available | |
| Lara Angeli Felipe F | $490,000 | Dqt |
Source: Public Records
Mortgage History
| Date | Status | Borrower | Loan Amount |
|---|---|---|---|
| Open | Winkle David | $520,000 |
Source: Public Records
Tax History
| Year | Tax Paid | Tax Assessment Tax Assessment Total Assessment is a certain percentage of the fair market value that is determined by local assessors to be the total taxable value of land and additions on the property. | Land | Improvement |
|---|---|---|---|---|
| 2024 | $10,652 | $727,600 | $108,400 | $619,200 |
| 2023 | $10,652 | $623,000 | $105,200 | $517,800 |
| 2022 | $7,462 | $627,700 | $105,200 | $522,500 |
| 2021 | $7,308 | $453,000 | $108,800 | $344,200 |
| 2020 | $7,520 | $453,000 | $108,800 | $344,200 |
| 2019 | $7,462 | $453,000 | $108,800 | $344,200 |
| 2018 | $6,980 | $453,000 | $108,800 | $344,200 |
| 2017 | $6,402 | $453,000 | $108,800 | $344,200 |
| 2016 | $6,242 | $190,600 | $23,200 | $167,400 |
| 2015 | $6,380 | $415,700 | $16,600 | $399,100 |
| 2014 | $6,380 | $415,700 | $16,600 | $399,100 |
Source: Public Records
Map
Nearby Homes
- 311 E Superior St Unit 704
- 311 E Superior St Unit 905
- 311 E Superior St
- 517 E 5th St
- 722 E 3rd St
- 409 E 6th St
- 609 N 4th Ave E
- 523 N 1st Ave E
- 202 E 7th St Unit D
- 1023 E 5th St
- 1211 E 1st St
- 1126 Mesaba Ave Unit 119
- 706 E 11th St
- 1205 E 3rd St
- 701 E 11th St
- 1125 N 7th Ave E
- XXX E Ninth St
- XXX E 13th St
- 419 N 13th Ave E
- 1316 E 2nd St
- 311 E Superior St Unit 703
- 311 E Superior St Unit 1004
- 311 E Superior St Unit 1004
- 311 E Superior St Unit 1101
- 311 E Superior St Unit 1101
- 311 E Superior St Unit 905
- 311 E Superior St Unit 1102
- 311 E Superior St Unit 1102
- 311 E Superior St Unit 1003
- 311 E Superior St Unit 1003
- 311 E Superior St Unit 1002
- 311 E Superior St Unit 905
- 311 E Superior St Unit 902
- 311 E Superior St Unit 901
- 311 E Superior St Unit 805
- 311 E Superior St Unit 804
- 311 E Superior St Unit 802
- 311 E Superior St Unit 801
- 311 E Superior St Unit 701
- 311 E Superior St Unit 707
Your Personal Tour Guide
Ask me questions while you tour the home.