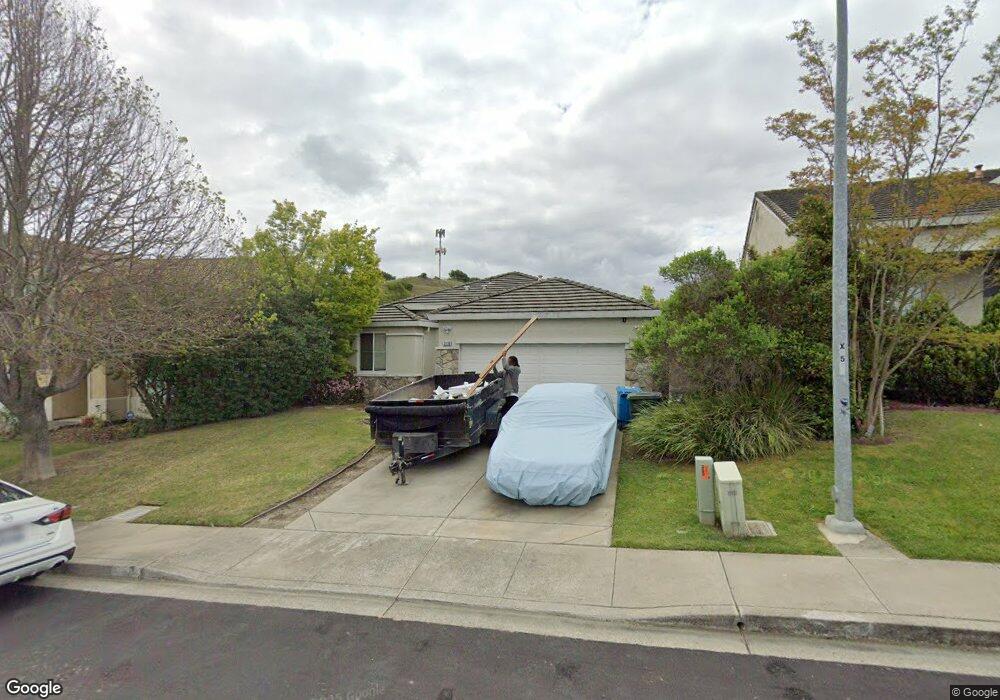
3116 Terrace Beach Dr Vallejo, CA 94591
Northgate NeighborhoodEstimated Value: $580,771 - $704,000
3
Beds
2
Baths
1,608
Sq Ft
$410/Sq Ft
Est. Value
About This Home
This home is located at 3116 Terrace Beach Dr, Vallejo, CA 94591 and is currently estimated at $658,943, approximately $409 per square foot. 3116 Terrace Beach Dr is a home located in Solano County with nearby schools including Joseph H. Wardlaw Elementary School, Hogan Middle School, and Jesse M. Bethel High School.
Ownership History
Date
Name
Owned For
Owner Type
Purchase Details
Closed on
Oct 5, 2011
Sold by
Residential Foreclosure Fund Ii Llc
Bought by
Merriman Carmen J
Current Estimated Value
Home Financials for this Owner
Home Financials are based on the most recent Mortgage that was taken out on this home.
Original Mortgage
$118,000
Outstanding Balance
$80,674
Interest Rate
4.15%
Mortgage Type
New Conventional
Estimated Equity
$578,269
Purchase Details
Closed on
Jun 9, 2011
Sold by
Domine Toribio A and Domine Jocelyne L
Bought by
Residential Foreclosure Fund Ii Llc
Purchase Details
Closed on
Jun 10, 1998
Sold by
Campobello Development Corp
Bought by
Domine Toribio A and Domine Jocelyne L
Home Financials for this Owner
Home Financials are based on the most recent Mortgage that was taken out on this home.
Original Mortgage
$171,427
Interest Rate
7.17%
Create a Home Valuation Report for This Property
The Home Valuation Report is an in-depth analysis detailing your home's value as well as a comparison with similar homes in the area
Home Values in the Area
Average Home Value in this Area
Purchase History
| Date | Buyer | Sale Price | Title Company |
|---|---|---|---|
| Merriman Carmen J | $245,000 | North American Title Company | |
| Residential Foreclosure Fund Ii Llc | $193,200 | None Available | |
| Domine Toribio A | $180,500 | First American Title Guarant |
Source: Public Records
Mortgage History
| Date | Status | Borrower | Loan Amount |
|---|---|---|---|
| Open | Merriman Carmen J | $118,000 | |
| Previous Owner | Domine Toribio A | $171,427 |
Source: Public Records
Tax History Compared to Growth
Tax History
| Year | Tax Paid | Tax Assessment Tax Assessment Total Assessment is a certain percentage of the fair market value that is determined by local assessors to be the total taxable value of land and additions on the property. | Land | Improvement |
|---|---|---|---|---|
| 2025 | $5,560 | $307,721 | $69,077 | $238,644 |
| 2024 | $5,560 | $301,688 | $67,723 | $233,965 |
| 2023 | $5,298 | $295,774 | $66,396 | $229,378 |
| 2022 | $5,205 | $289,976 | $65,095 | $224,881 |
| 2021 | $5,113 | $284,291 | $63,819 | $220,472 |
| 2020 | $5,132 | $281,377 | $63,165 | $218,212 |
| 2019 | $5,008 | $275,861 | $61,927 | $213,934 |
| 2018 | $4,753 | $270,453 | $60,713 | $209,740 |
| 2017 | $4,579 | $265,151 | $59,523 | $205,628 |
| 2016 | $4,010 | $259,953 | $58,356 | $201,597 |
| 2015 | $3,971 | $256,049 | $57,480 | $198,569 |
| 2014 | $3,923 | $251,035 | $56,355 | $194,680 |
Source: Public Records
Map
Nearby Homes
- 2011 Agate Ct
- 6206 Pebble Beach Dr
- 2139 Garnet Cir
- 367 Darley Dr
- 3554 Calm Breeze Ct
- 7809 Caracena Ct
- 559 Topley Ct
- 1132 Waltz Ct
- 6857 Sunriver Ln
- 1146 Waltz Ct
- 1233 Symphony Way
- 400 Foothill Dr
- 131 Sheila Ct
- 9216 Hallmark Place
- 100 Percheron Ct
- 6320 Pebble Beach Dr
- 272 Woodridge Dr
- 121 Kim Ct
- 2890 Redwood Pkwy Unit 61
- 136 Evergreen Way
- 3108 Terrace Beach Dr
- 3124 Terrace Beach Dr
- 3132 Terrace Beach Dr
- 3100 Terrace Beach Dr
- 3066 Clear Coast Ct
- 3401 Edgewater Place
- 3140 Terrace Beach Dr
- 3060 Clear Coast Ct
- 3400 Edgewater Place
- 3148 Terrace Beach Dr
- 3403 Edgewater Place
- 3098 Sunny Cove Ct
- 3054 Clear Coast Ct
- 3097 Sunny Cove Ct
- 3402 Edgewater Place
- 3067 Clear Coast Ct
- 3156 Terrace Beach Dr
- 3405 Edgewater Place
- 3404 Edgewater Place
- 3048 Clear Coast Ct