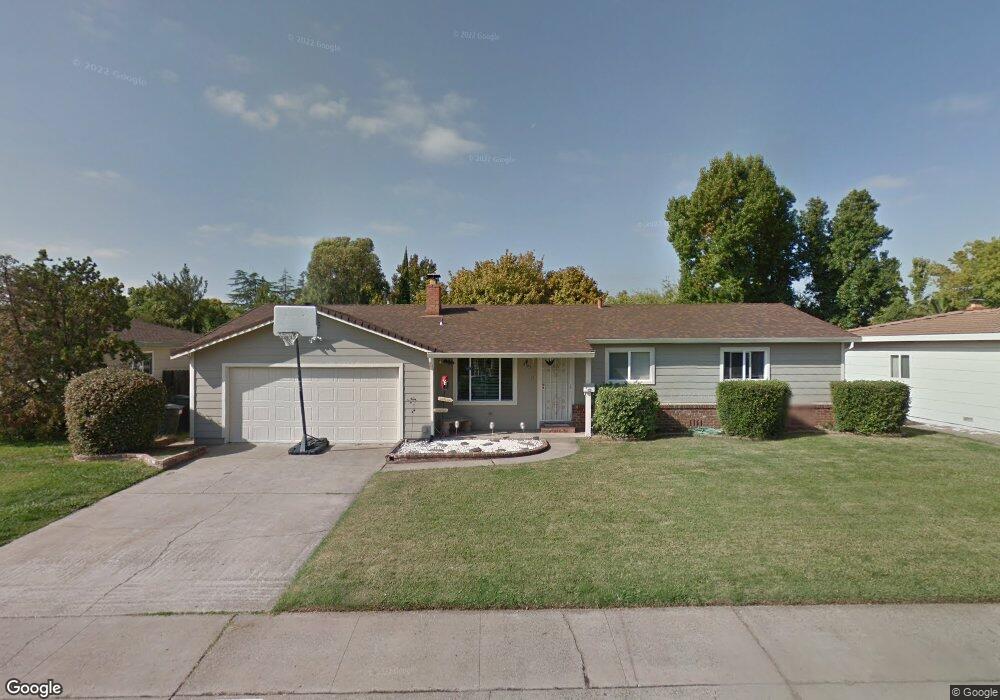
3127 Terry Way Carmichael, CA 95608
Carmichael Town Center NeighborhoodEstimated Value: $344,000 - $557,000
3
Beds
2
Baths
2,656
Sq Ft
$188/Sq Ft
Est. Value
About This Home
This home is located at 3127 Terry Way, Carmichael, CA 95608 and is currently estimated at $499,604, approximately $188 per square foot. 3127 Terry Way is a home located in Sacramento County with nearby schools including Carmichael Elementary School, John Barrett Middle School, and Del Campo High School.
Ownership History
Date
Name
Owned For
Owner Type
Purchase Details
Closed on
Dec 12, 2008
Sold by
Hoppe Bruce B and Hoppe Robin S
Bought by
Hoppe Bruce B and Hoppe Robin S
Current Estimated Value
Purchase Details
Closed on
Jun 9, 2003
Sold by
Hoppe Bruce B and Hoppe Robin S
Bought by
Hoppe Bruce B and Hoppe Robin S
Home Financials for this Owner
Home Financials are based on the most recent Mortgage that was taken out on this home.
Original Mortgage
$171,000
Outstanding Balance
$73,982
Interest Rate
5.61%
Mortgage Type
Purchase Money Mortgage
Estimated Equity
$425,622
Purchase Details
Closed on
Jul 21, 1999
Sold by
Briles Louise A
Bought by
Hoppe Bruce B and Hoppe Robin S
Home Financials for this Owner
Home Financials are based on the most recent Mortgage that was taken out on this home.
Original Mortgage
$105,600
Interest Rate
7.64%
Create a Home Valuation Report for This Property
The Home Valuation Report is an in-depth analysis detailing your home's value as well as a comparison with similar homes in the area
Home Values in the Area
Average Home Value in this Area
Purchase History
| Date | Buyer | Sale Price | Title Company |
|---|---|---|---|
| Hoppe Bruce B | -- | None Available | |
| Hoppe Bruce B | -- | Alliance Title Company | |
| Hoppe Bruce B | $132,000 | Placer Title Company |
Source: Public Records
Mortgage History
| Date | Status | Borrower | Loan Amount |
|---|---|---|---|
| Open | Hoppe Bruce B | $171,000 | |
| Closed | Hoppe Bruce B | $105,600 |
Source: Public Records
Tax History
| Year | Tax Paid | Tax Assessment Tax Assessment Total Assessment is a certain percentage of the fair market value that is determined by local assessors to be the total taxable value of land and additions on the property. | Land | Improvement |
|---|---|---|---|---|
| 2025 | $3,658 | $308,117 | $84,520 | $223,597 |
| 2024 | $3,658 | $302,076 | $82,863 | $219,213 |
| 2023 | $3,600 | $296,154 | $81,239 | $214,915 |
| 2022 | $3,528 | $290,348 | $79,647 | $210,701 |
| 2021 | $3,470 | $284,656 | $78,086 | $206,570 |
| 2020 | $3,405 | $281,738 | $77,286 | $204,452 |
| 2019 | $3,337 | $276,215 | $75,771 | $200,444 |
| 2018 | $3,293 | $270,800 | $74,286 | $196,514 |
| 2017 | $3,266 | $265,491 | $72,830 | $192,661 |
| 2016 | $3,051 | $260,286 | $71,402 | $188,884 |
| 2015 | $3,044 | $256,377 | $70,330 | $186,047 |
| 2014 | $2,981 | $251,356 | $68,953 | $182,403 |
Source: Public Records
Map
Nearby Homes
- 5113 Walnut Garden Ct
- 3312 Jayanne Way
- 5236 Marconi Ave
- 3332 Jayanne Way
- 5151 Janell Way
- 2905 Garfield Ave
- 3431 Hunter Ln
- 2855 La Colina Way
- 4905 Heatherdale Ln
- 3041 Root Ave
- 4838 Robertson Ave
- 4532 Foster Way
- 3125 Colorado St
- 5530 Kenneth Ave
- 4719 Eli Ct
- 4740 Whitney Ave
- 2546 El Vita Way
- 5132 El Camino Ave Unit 108
- 5132 El Camino Ave Unit 202
- 4845 Hazelwood Ave
Your Personal Tour Guide
Ask me questions while you tour the home.