Estimated Value: $305,000 - $405,000
3
Beds
2
Baths
1,144
Sq Ft
$318/Sq Ft
Est. Value
About This Home
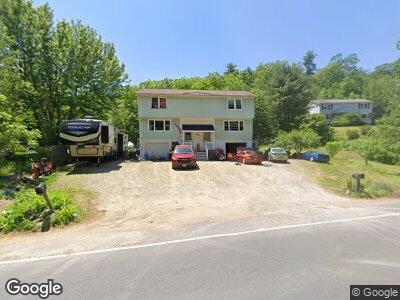
This home is located at 317 Island Pond Rd Unit L, Derry, NH 03038 and is currently estimated at $363,270, approximately $317 per square foot. 317 Island Pond Rd Unit L is a home located in Rockingham County with nearby schools including East Derry Memorial Elementary School, West Running Brook Middle School, and Pinkerton Academy.
Ownership History
Date
Name
Owned For
Owner Type
Purchase Details
Closed on
Sep 30, 2020
Sold by
Lambert Laura L
Bought by
Price John J
Current Estimated Value
Home Financials for this Owner
Home Financials are based on the most recent Mortgage that was taken out on this home.
Original Mortgage
$229,405
Outstanding Balance
$206,336
Interest Rate
2.9%
Mortgage Type
New Conventional
Estimated Equity
$134,967
Purchase Details
Closed on
Mar 5, 2019
Sold by
Chorney-White Jeanny
Bought by
Lambert Laura L
Home Financials for this Owner
Home Financials are based on the most recent Mortgage that was taken out on this home.
Original Mortgage
$89,600
Interest Rate
4.4%
Mortgage Type
Purchase Money Mortgage
Purchase Details
Closed on
May 2, 2007
Sold by
Deutsche Bank Natl T C
Bought by
Chorney-White Jeanny
Home Financials for this Owner
Home Financials are based on the most recent Mortgage that was taken out on this home.
Original Mortgage
$137,000
Interest Rate
6.23%
Create a Home Valuation Report for This Property
The Home Valuation Report is an in-depth analysis detailing your home's value as well as a comparison with similar homes in the area
Home Values in the Area
Average Home Value in this Area
Purchase History
| Date | Buyer | Sale Price | Title Company |
|---|---|---|---|
| Price John J | $236,533 | None Available | |
| Lambert Laura L | $112,000 | -- | |
| Chorney-White Jeanny | $149,000 | -- |
Source: Public Records
Mortgage History
| Date | Status | Borrower | Loan Amount |
|---|---|---|---|
| Open | Price John J | $229,405 | |
| Previous Owner | Lambert Laura | $159,000 | |
| Previous Owner | Lambert Laura L | $89,600 | |
| Previous Owner | Chorney-White Jeanny | $137,000 | |
| Previous Owner | Robertson Armand C | $147,500 | |
| Previous Owner | Ohanlon Charles W | $144,000 |
Source: Public Records
Tax History Compared to Growth
Tax History
| Year | Tax Paid | Tax Assessment Tax Assessment Total Assessment is a certain percentage of the fair market value that is determined by local assessors to be the total taxable value of land and additions on the property. | Land | Improvement |
|---|---|---|---|---|
| 2024 | $5,478 | $293,100 | $0 | $293,100 |
| 2023 | $5,156 | $249,300 | $0 | $249,300 |
| 2022 | $4,747 | $249,300 | $0 | $249,300 |
| 2021 | $4,907 | $198,200 | $0 | $198,200 |
| 2020 | $4,824 | $198,200 | $0 | $198,200 |
| 2019 | $4,819 | $184,500 | $97,000 | $87,500 |
| 2018 | $5,312 | $188,400 | $97,000 | $91,400 |
| 2017 | $5,167 | $178,500 | $92,200 | $86,300 |
| 2016 | $4,830 | $178,500 | $92,200 | $86,300 |
| 2015 | $4,157 | $142,200 | $69,100 | $73,100 |
| 2014 | $4,184 | $142,200 | $69,100 | $73,100 |
| 2013 | $4,324 | $137,300 | $63,300 | $74,000 |
Source: Public Records
Map
Nearby Homes
- 35 Steele Rd
- 345 Island Pond Rd
- 9 Bartlett Rd
- 2 Germantown Rd
- 117A Chases Grove Rd
- 5 Hampshire Dr
- 915 Whitneys Grove
- 915 Whitney Grove Rd
- 160 N Shore Rd
- 1011 Collettes Grove Rd
- 17 Whitney Grove Rd
- 38 Jackman Rd
- 27 Gulf Rd
- 7 Lippold Rd
- Lot 22-50 Valcat Ln
- 9 Valcat Ln
- 10E Chase Island Rd
- 167 Island Pond Rd
- 73 Drew Rd
- 145 Warner Hill Rd
- 317 Island Pond Rd Unit R
- 317 Island Pond Rd Unit L
- 319 Island Pond Rd
- 315 Island Pond Rd
- 315 Island Pond Rd Unit R
- 315 Island Pond Rd Unit L
- 315 Island Pond Rd Unit 315R
- 321 Island Pond Rd
- 326 Island Pond Rd
- 328 Island Pond Rd
- 327 Island Pond Rd
- 101 N Shore Rd
- 330 Island Pond Rd
- 103 N Shore Rd
- 329 Island Pond Rd
- 108 N Shore Rd
- 310 Island Pond Rd
- 2 Weston St
- 331 Island Pond Rd
- 313 Island Pond Rd Unit R