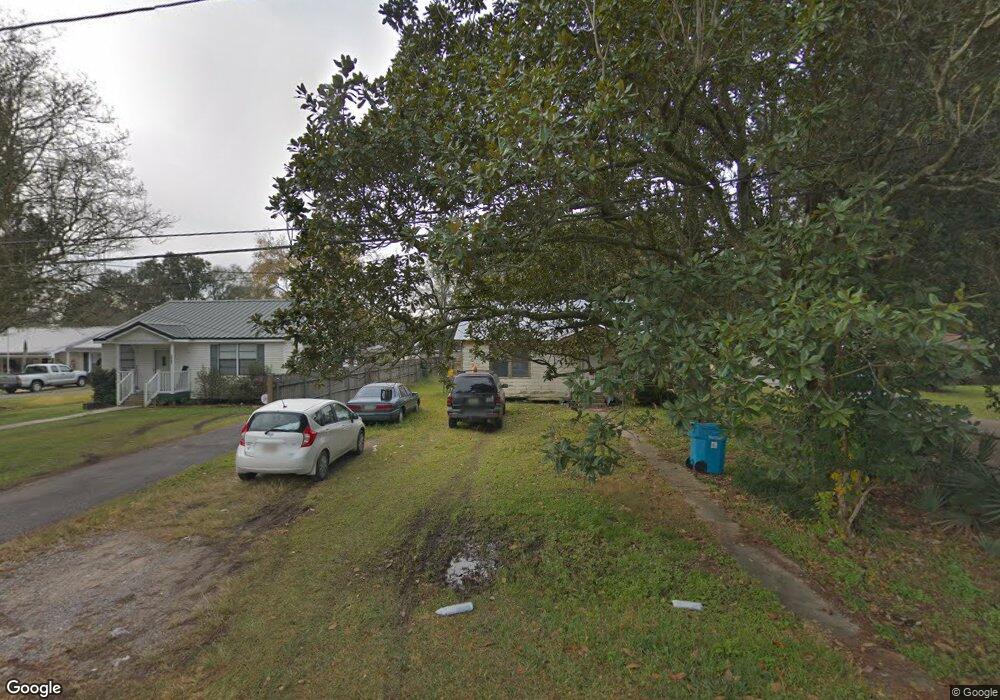
320 4th St Luling, LA 70070
Estimated Value: $166,498 - $221,000
Studio
--
Bath
1,300
Sq Ft
$153/Sq Ft
Est. Value
About This Home
This home is located at 320 4th St, Luling, LA 70070 and is currently estimated at $198,375, approximately $152 per square foot. 320 4th St is a home located in St. Charles Parish with nearby schools including Luling Elementary School, R.K. Smith Middle School, and Hahnville High School.
Create a Home Valuation Report for This Property
The Home Valuation Report is an in-depth analysis detailing your home's value as well as a comparison with similar homes in the area
Home Values in the Area
Average Home Value in this Area
Tax History
| Year | Tax Paid | Tax Assessment Tax Assessment Total Assessment is a certain percentage of the fair market value that is determined by local assessors to be the total taxable value of land and additions on the property. | Land | Improvement |
|---|---|---|---|---|
| 2025 | $261 | $12,670 | $3,050 | $9,620 |
| 2024 | $261 | $12,670 | $3,050 | $9,620 |
| 2023 | $0 | $5,412 | $3,330 | $2,082 |
| 2022 | $633 | $5,412 | $3,330 | $2,082 |
| 2021 | $599 | $5,079 | $2,997 | $2,082 |
| 2020 | $885 | $7,492 | $3,330 | $4,162 |
| 2019 | $888 | $7,492 | $2,760 | $4,732 |
| 2018 | $882 | $7,492 | $2,760 | $4,732 |
| 2017 | $881 | $7,492 | $2,760 | $4,732 |
| 2016 | $884 | $7,492 | $2,760 | $4,732 |
| 2015 | $33 | $7,778 | $1,060 | $6,718 |
| 2014 | $32 | $7,778 | $1,060 | $6,718 |
| 2013 | $32 | $7,778 | $1,060 | $6,718 |
Source: Public Records
Map
Nearby Homes
- 304 4th St
- 514 Milling Ave
- 708 Sugarhouse Rd
- 412 Milling Ave
- 131 Antoine Ln
- 826 Mongrue St
- 1008 Gassen St
- 1262 Luling Estates Dr
- 109 Lac Cypriere Dr
- 112 Allie Ln
- 1214 Gassen St
- 1216 Gassen St
- 214 Ashton Oaks Ln
- 204 Lac Segnette Dr
- 301 Allie Ln
- LOTS J2A 3-4-5-&6 E Campus Dr
- LOTS J2A 3-4-5- E Campus Dr
- LOT J2A-5&6 E Campus Dr
Your Personal Tour Guide
Ask me questions while you tour the home.