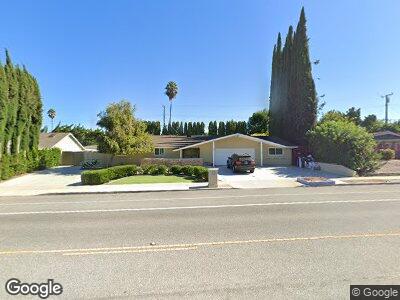
321 E Gainsborough Rd Thousand Oaks, CA 91360
Estimated Value: $924,000 - $1,154,000
4
Beds
3
Baths
2,265
Sq Ft
$457/Sq Ft
Est. Value
About This Home
This home is located at 321 E Gainsborough Rd, Thousand Oaks, CA 91360 and is currently estimated at $1,035,176, approximately $457 per square foot. 321 E Gainsborough Rd is a home located in Ventura County with nearby schools including Glenwood Elementary School, Redwood Middle School, and Thousand Oaks High School.
Ownership History
Date
Name
Owned For
Owner Type
Purchase Details
Closed on
Jun 23, 2020
Sold by
Luis Lopez Jose and Luis Rebeca Lopez
Bought by
Lopez Jose Luis and Lopez Rebeca
Current Estimated Value
Purchase Details
Closed on
Nov 18, 2016
Sold by
Canfield Charles B and Ott Dottie June
Bought by
Lopez Jose Luis and Lopez Rebeca
Purchase Details
Closed on
Oct 17, 2016
Sold by
Potter Patricia R
Bought by
Canfield Charles B and Ott Dottie June
Purchase Details
Closed on
Nov 21, 2002
Sold by
Canfield Luella
Bought by
Canfield Luella
Home Financials for this Owner
Home Financials are based on the most recent Mortgage that was taken out on this home.
Original Mortgage
$392,413
Interest Rate
2.96%
Mortgage Type
Reverse Mortgage Home Equity Conversion Mortgage
Create a Home Valuation Report for This Property
The Home Valuation Report is an in-depth analysis detailing your home's value as well as a comparison with similar homes in the area
Home Values in the Area
Average Home Value in this Area
Purchase History
| Date | Buyer | Sale Price | Title Company |
|---|---|---|---|
| Lopez Jose Luis | -- | None Available | |
| Lopez Jose Luis | $565,000 | First American Title Company | |
| Canfield Charles B | -- | None Available | |
| Canfield Luella | -- | Fidelity National Title Co | |
| Canfield Luella | -- | Fidelity National Title Co |
Source: Public Records
Mortgage History
| Date | Status | Borrower | Loan Amount |
|---|---|---|---|
| Previous Owner | Canfield Luella | $392,413 | |
| Previous Owner | Canfield Luella | $392,413 |
Source: Public Records
Tax History Compared to Growth
Tax History
| Year | Tax Paid | Tax Assessment Tax Assessment Total Assessment is a certain percentage of the fair market value that is determined by local assessors to be the total taxable value of land and additions on the property. | Land | Improvement |
|---|---|---|---|---|
| 2024 | $7,268 | $642,868 | $418,150 | $224,718 |
| 2023 | $7,056 | $630,263 | $409,951 | $220,312 |
| 2022 | $6,933 | $617,905 | $401,912 | $215,993 |
| 2021 | $6,817 | $605,790 | $394,032 | $211,758 |
| 2020 | $6,375 | $599,581 | $389,993 | $209,588 |
| 2019 | $6,207 | $587,826 | $382,347 | $205,479 |
| 2018 | $6,084 | $576,300 | $374,850 | $201,450 |
| 2017 | $5,967 | $565,000 | $367,500 | $197,500 |
| 2016 | $930 | $86,895 | $18,588 | $68,307 |
| 2015 | $914 | $85,591 | $18,309 | $67,282 |
| 2014 | $900 | $83,916 | $17,951 | $65,965 |
Source: Public Records
Map
Nearby Homes
- 168 E Gainsborough Rd
- 778 Spalding St
- 1491 Warwick Ave
- 1230 Dover Ave
- 8 W Janss Rd
- 1633 Montgomery Rd
- 1572 Dover Ave
- 1580 Dover Ave
- 531 Benson Way
- 1154 La Jolla Dr
- 1250 La Peresa Dr
- 647 Brossard Dr
- 200 Oakleaf Dr Unit 207
- 789 Glen Oaks Rd
- 245 Oakleaf Dr Unit 102
- 245 Oakleaf Dr Unit 205
- 254 Sequoia Ct Unit 12
- 255 Sequoia Ct Unit 21
- 321 E Gainsborough Rd
- 321 E Gainsborough Rd
- 309 E Gainsborough Rd
- 335 E Gainsborough Rd
- 1204 Coventry Dr
- 1220 Coventry Dr
- 1180 Coventry Dr
- 1234 Coventry Dr
- 318 E Gainsborough Rd
- 299 E Gainsborough Rd
- 332 E Gainsborough Rd Unit Adu
- 332 E Gainsborough Rd
- 343 E Gainsborough Rd
- 304 E Gainsborough Rd
- 1174 Coventry Dr
- 1250 Coventry Dr
- 346 E Gainsborough Rd
- 1217 Coventry Dr
- 1203 Coventry Dr
- 296 E Gainsborough Rd