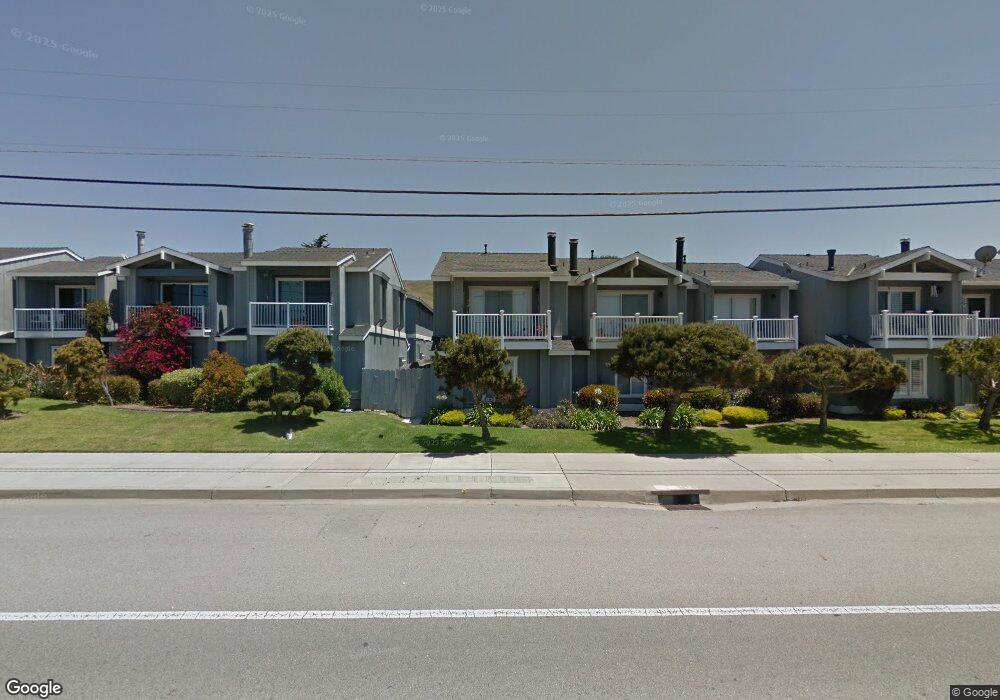
321 Sequoia St Unit 6 Morro Bay, CA 93442
Estimated Value: $603,328 - $670,000
2
Beds
2
Baths
1,206
Sq Ft
$533/Sq Ft
Est. Value
About This Home
This home is located at 321 Sequoia St Unit 6, Morro Bay, CA 93442 and is currently estimated at $643,082, approximately $533 per square foot. 321 Sequoia St Unit 6 is a home located in San Luis Obispo County with nearby schools including Del Mar Elementary School, Los Osos Middle School, and Morro Bay High School.
Ownership History
Date
Name
Owned For
Owner Type
Purchase Details
Closed on
Sep 18, 2020
Sold by
Demirjian Simon and Demirjian Nancy
Bought by
Judd Gregory L
Current Estimated Value
Purchase Details
Closed on
Jun 23, 2006
Sold by
Demirjian Nancy Judd
Bought by
Demirjian Simon and Demirjian Nancy Judd
Purchase Details
Closed on
Sep 8, 2000
Sold by
Bettencourt Katherine Tena
Bought by
Serpa Matilda D and Matilda D Serpa Living Trust
Purchase Details
Closed on
Aug 29, 2000
Sold by
Quigley William R and Quigley Paula M
Bought by
Demirjian Nancy Judd
Purchase Details
Closed on
Aug 21, 2000
Sold by
Demirjian Simon
Bought by
Demirjian Nancy Judd
Purchase Details
Closed on
Jul 11, 2000
Sold by
Shadowbrook Apartments
Bought by
Simonian Dennis Lee and Simonian Bonnie Ann
Create a Home Valuation Report for This Property
The Home Valuation Report is an in-depth analysis detailing your home's value as well as a comparison with similar homes in the area
Home Values in the Area
Average Home Value in this Area
Purchase History
| Date | Buyer | Sale Price | Title Company |
|---|---|---|---|
| Judd Gregory L | -- | Law Offices Of Philip M Flanig | |
| Demirjian Simon | -- | None Available | |
| Serpa Matilda D | $695,000 | First American Title | |
| Demirjian Nancy Judd | $180,000 | First American Title | |
| Demirjian Nancy Judd | -- | First American Title Ins Co | |
| Simonian Dennis Lee | -- | First American Title | |
| Simonian Dennis Lee | -- | First American Title | |
| Simonian Dennis Lee | -- | First American Title |
Source: Public Records
Tax History
| Year | Tax Paid | Tax Assessment Tax Assessment Total Assessment is a certain percentage of the fair market value that is determined by local assessors to be the total taxable value of land and additions on the property. | Land | Improvement |
|---|---|---|---|---|
| 2025 | $2,939 | $271,209 | $120,536 | $150,673 |
| 2024 | $2,885 | $265,892 | $118,173 | $147,719 |
| 2023 | $2,885 | $260,679 | $115,856 | $144,823 |
| 2022 | $2,705 | $255,569 | $113,585 | $141,984 |
| 2021 | $2,662 | $250,558 | $111,358 | $139,200 |
| 2020 | $2,634 | $247,990 | $110,217 | $137,773 |
| 2019 | $2,607 | $243,128 | $108,056 | $135,072 |
| 2018 | $2,556 | $238,362 | $105,938 | $132,424 |
| 2017 | $2,506 | $233,689 | $103,861 | $129,828 |
| 2016 | $2,457 | $229,108 | $101,825 | $127,283 |
| 2015 | $2,419 | $225,668 | $100,296 | $125,372 |
| 2014 | $2,221 | $221,249 | $98,332 | $122,917 |
Source: Public Records
Map
Nearby Homes
- 2900 Alder Ave
- 410 Island St
- 3020 Ironwood Ave
- 2783 Coral Ave
- 440 Luzon St
- 390 Nassau St
- 670 Sequoia Ct
- 650 Sequoia Ct
- 351 Nevis St
- 2785 Hemlock Ave
- 390 Panay St
- 440 Panay St
- 679 Elena St
- 2600 Ironwood Ave
- 474 Whidbey Way
- 2581 Juniper Ave
- 3329 Panorama Dr
- 2560 Juniper Ave
- 485 Bonita St
- 2350 Nutmeg Ave
- 317 Sequoia St Unit 5
- 3020 Main St
- 313 Sequoia St Unit 4
- 313 Sequoia St
- 3032 Main St Unit 17
- 3032 Main St
- 325 Sequoia St Unit 7
- 3022 Main St
- 309 Sequoia St
- 3034 Main St
- 329 Sequoia St Unit 8
- 3024 Main St Unit 14
- 3024 Main St Unit 120
- 305 Sequoia St
- 333 Sequoia St Unit 9
- 3026 Main St
- 3036 Main St Unit 19
- 301 Sequoia St
- 3038 Main St
- 337 Sequoia St
Your Personal Tour Guide
Ask me questions while you tour the home.