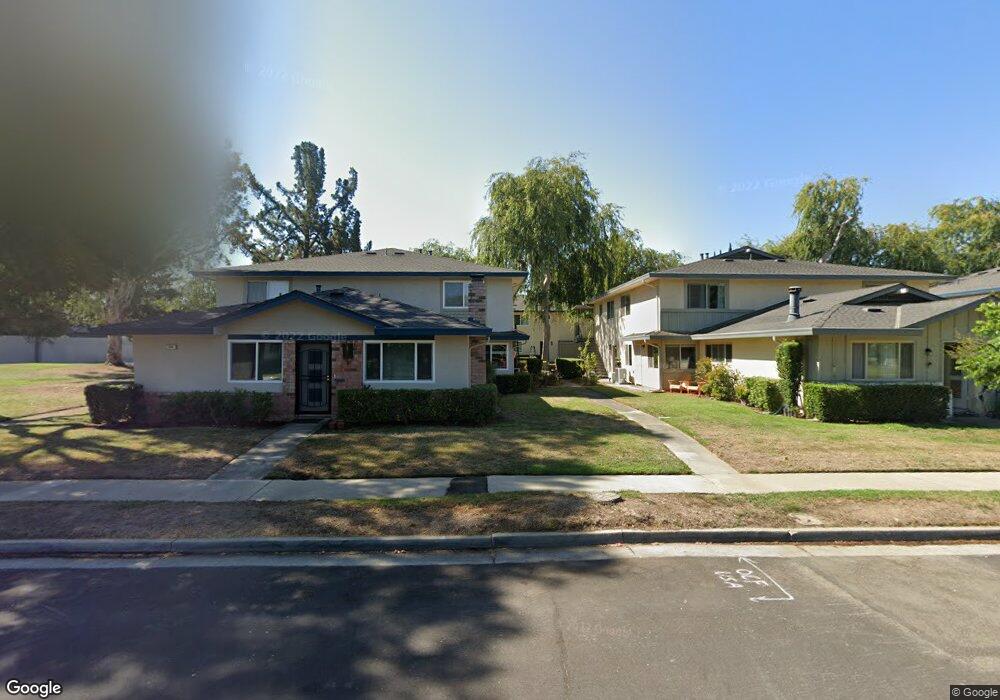
323 N 2nd St Unit 4 Campbell, CA 95008
Downtown Campbell NeighborhoodEstimated Value: $644,045 - $705,000
2
Beds
1
Bath
798
Sq Ft
$843/Sq Ft
Est. Value
About This Home
This home is located at 323 N 2nd St Unit 4, Campbell, CA 95008 and is currently estimated at $673,011, approximately $843 per square foot. 323 N 2nd St Unit 4 is a home located in Santa Clara County with nearby schools including Rosemary Elementary School, Del Mar High School, and Campbell School of Innovation.
Ownership History
Date
Name
Owned For
Owner Type
Purchase Details
Closed on
Feb 7, 2001
Sold by
Medeiros Edward S and Medeiros Pauline C Y
Bought by
Wuischpard Marc H
Current Estimated Value
Home Financials for this Owner
Home Financials are based on the most recent Mortgage that was taken out on this home.
Original Mortgage
$241,900
Outstanding Balance
$87,378
Interest Rate
7.08%
Estimated Equity
$585,633
Purchase Details
Closed on
Jul 8, 1998
Sold by
Medeiros Pauline C and Medeiros Edward S
Bought by
Medeiros John and Medeiros Arlene
Create a Home Valuation Report for This Property
The Home Valuation Report is an in-depth analysis detailing your home's value as well as a comparison with similar homes in the area
Home Values in the Area
Average Home Value in this Area
Purchase History
| Date | Buyer | Sale Price | Title Company |
|---|---|---|---|
| Wuischpard Marc H | $269,000 | Fidelity National Title Co | |
| Medeiros John | -- | -- |
Source: Public Records
Mortgage History
| Date | Status | Borrower | Loan Amount |
|---|---|---|---|
| Open | Wuischpard Marc H | $241,900 |
Source: Public Records
Tax History Compared to Growth
Tax History
| Year | Tax Paid | Tax Assessment Tax Assessment Total Assessment is a certain percentage of the fair market value that is determined by local assessors to be the total taxable value of land and additions on the property. | Land | Improvement |
|---|---|---|---|---|
| 2025 | $5,709 | $404,943 | $75,330 | $329,613 |
| 2024 | $5,709 | $397,003 | $73,853 | $323,150 |
| 2023 | $5,638 | $389,219 | $72,405 | $316,814 |
| 2022 | $5,651 | $381,588 | $70,986 | $310,602 |
| 2021 | $5,536 | $374,107 | $69,595 | $304,512 |
| 2020 | $5,383 | $370,272 | $68,882 | $301,390 |
| 2019 | $5,296 | $363,013 | $67,532 | $295,481 |
| 2018 | $5,128 | $355,896 | $66,208 | $289,688 |
| 2017 | $5,044 | $348,918 | $64,910 | $284,008 |
| 2016 | $4,737 | $342,078 | $63,638 | $278,440 |
| 2015 | $4,640 | $336,941 | $62,683 | $274,258 |
| 2014 | $4,428 | $330,342 | $61,456 | $268,886 |
Source: Public Records
Map
Nearby Homes
- 390 N 1st St Unit 2
- 21 N 2nd St Unit 303
- 178 Salmar Terrace
- 411 Dunster Dr
- 665 Hawthorne Ave
- 238 Railway Ave
- 3228 Williamsburg Dr
- 195 Sunnyside Ave
- 160 Quail Hollow Dr Unit 160A
- 120 Kennedy Ave
- 919 Ravenscourt Ave
- 47 Quail Hollow Dr Unit 47
- 26 Quail Hollow Dr Unit 26
- 102 Quail Hollow Dr Unit 102
- 1329 Essex Way
- 540 Valley Forge Way
- 3264 Valley Square Ln
- 870 Camden Ave Unit 96
- 99 Timber Cove Dr Unit 99
- 1350 Merrivale Square W
- 323 N 2nd St Unit 3
- 323 N 2nd St Unit 2
- 323 N 2nd St Unit 1
- 311 N 2nd St Unit 4
- 311 N 2nd St Unit 3
- 311 N 2nd St Unit 2
- 311 N 2nd St Unit 1
- 234 Gomes Ct Unit 4
- 234 Gomes Ct Unit 3
- 234 Gomes Ct Unit 2
- 234 Gomes Ct Unit 1
- 244 Gomes Ct Unit 4
- 244 Gomes Ct Unit 3
- 244 Gomes Ct Unit 1
- 314 N 3rd St Unit 3
- 314 N 3rd St Unit 2
- 314 N 3rd St Unit 1
- 214 Gomes Ct Unit 4
- 214 Gomes Ct Unit 3
- 214 Gomes Ct Unit 2