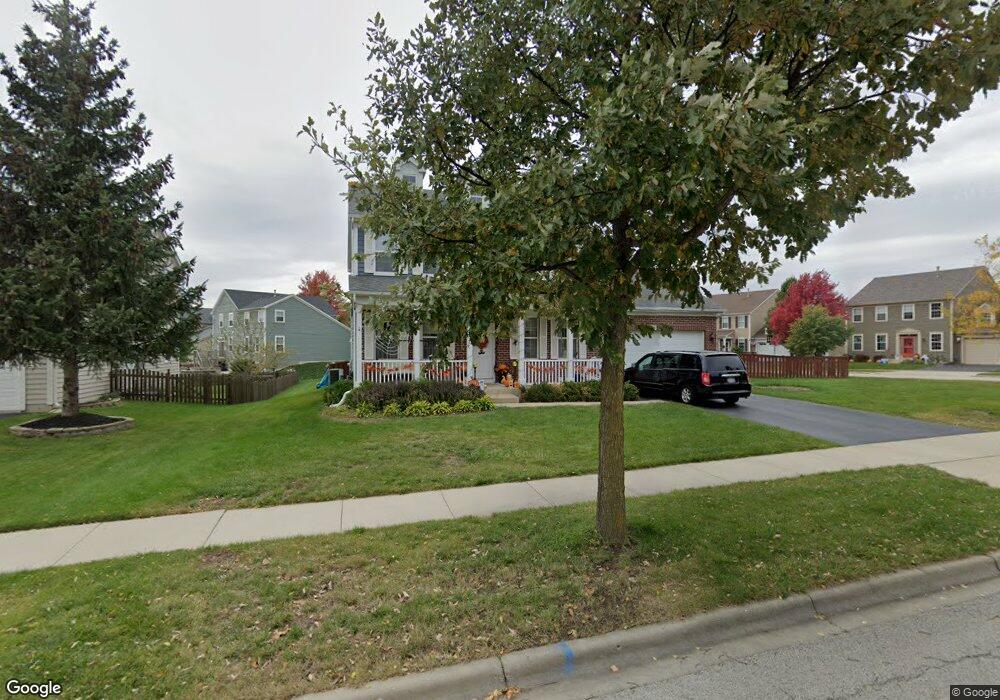
326 Fountain Ave Unit 2A Elgin, IL 60124
Providence NeighborhoodEstimated Value: $436,000 - $498,000
4
Beds
3
Baths
2,499
Sq Ft
$189/Sq Ft
Est. Value
About This Home
This home is located at 326 Fountain Ave Unit 2A, Elgin, IL 60124 and is currently estimated at $472,560, approximately $189 per square foot. 326 Fountain Ave Unit 2A is a home located in Kane County with nearby schools including Prairie View Grade School, Prairie Knolls Middle School, and Central Middle School.
Ownership History
Date
Name
Owned For
Owner Type
Purchase Details
Closed on
Feb 5, 2011
Sold by
Moore Joshua N and Moore Jessica J
Bought by
Sacomano Daniel and Sacomano Patricia
Current Estimated Value
Home Financials for this Owner
Home Financials are based on the most recent Mortgage that was taken out on this home.
Original Mortgage
$197,723
Outstanding Balance
$135,104
Interest Rate
4.75%
Mortgage Type
FHA
Estimated Equity
$337,456
Purchase Details
Closed on
May 26, 2006
Sold by
Pinnacle Corp
Bought by
Moore Joshua N and Moore Jessica J
Home Financials for this Owner
Home Financials are based on the most recent Mortgage that was taken out on this home.
Original Mortgage
$287,484
Interest Rate
6.68%
Mortgage Type
Purchase Money Mortgage
Create a Home Valuation Report for This Property
The Home Valuation Report is an in-depth analysis detailing your home's value as well as a comparison with similar homes in the area
Home Values in the Area
Average Home Value in this Area
Purchase History
We collect this data history from publicly available records. To have your information removed, we recommend requesting removal directly through your county’s website.
| Date | Buyer | Sale Price | Title Company |
|---|---|---|---|
| Sacomano Daniel | $203,000 | Chicago Title Insurance Co | |
| Moore Joshua N | $359,500 | Chicago Title Insurance Co |
Source: Public Records
Mortgage History
We collect this data history from publicly available records. To have your information removed, we recommend requesting removal directly through your county’s website.
| Date | Status | Borrower | Loan Amount |
|---|---|---|---|
| Open | Sacomano Daniel | $197,723 | |
| Previous Owner | Moore Joshua N | $287,484 |
Source: Public Records
Tax History
| Year | Tax Paid | Tax Assessment Tax Assessment Total Assessment is a certain percentage of the fair market value that is determined by local assessors to be the total taxable value of land and additions on the property. | Land | Improvement |
|---|---|---|---|---|
| 2024 | $10,900 | $132,131 | $39,827 | $92,304 |
| 2023 | $10,446 | $119,371 | $35,981 | $83,390 |
| 2022 | $9,853 | $108,845 | $32,808 | $76,037 |
| 2021 | $9,525 | $101,762 | $30,673 | $71,089 |
| 2020 | $9,247 | $97,147 | $29,282 | $67,865 |
| 2019 | $8,965 | $92,539 | $27,893 | $64,646 |
| 2018 | $9,157 | $93,424 | $26,277 | $67,147 |
| 2017 | $8,723 | $88,319 | $24,841 | $63,478 |
| 2016 | $8,689 | $81,936 | $23,046 | $58,890 |
| 2015 | -- | $75,102 | $21,124 | $53,978 |
| 2014 | -- | $65,155 | $20,863 | $44,292 |
| 2013 | -- | $66,152 | $21,413 | $44,739 |
Source: Public Records
Map
Nearby Homes
- 3084 Seekonk Ave
- 3138 Taunton St
- 239 Pawtucket Ave
- 3307 Wanskuck St
- 3311 Lafayette St
- 380 Fountain Ave
- 3059 Longcommon Pkwy
- 3091 Long Common Pkwy
- 326 Copper Springs Ln
- 394 Rockland Ave
- 266 Snowdrop Ln
- 278 Snowdrop Ln
- 281 Snowdrop Ln
- 283 Snowdrop Ln
- 289 Snowdrop Ln
- 343 Copper Springs Ln
- 3764 Saint James Ct
- 285 Snowdrop Ln
- 3030 Seekonk Ave
- 280 Snow Drop Ln
- 328 Fountain Ave
- 3111 Chalkstone Ave
- 330 Fountain Ave
- 3101 Chalkstone Ave
- 3106 Chalkstone Ave
- 3104 Chalkstone Ave
- 3113 Chalkstone Ave
- 3108 Chalkstone Ave
- 3102 Chalkstone Ave
- 3110 Chalkstone Ave
- 332 Fountain Ave
- 3099 Chalkstone Ave
- 3100 Chalkstone Ave
- 3115 Chalkstone Ave
- 3098 Chalkstone Ave
- 3112 Chalkstone Ave
- 334 Fountain Ave
- 211 Springside Dr
- 209 Springside Dr
- 3097 Chalkstone Ave
Your Personal Tour Guide
Ask me questions while you tour the home.