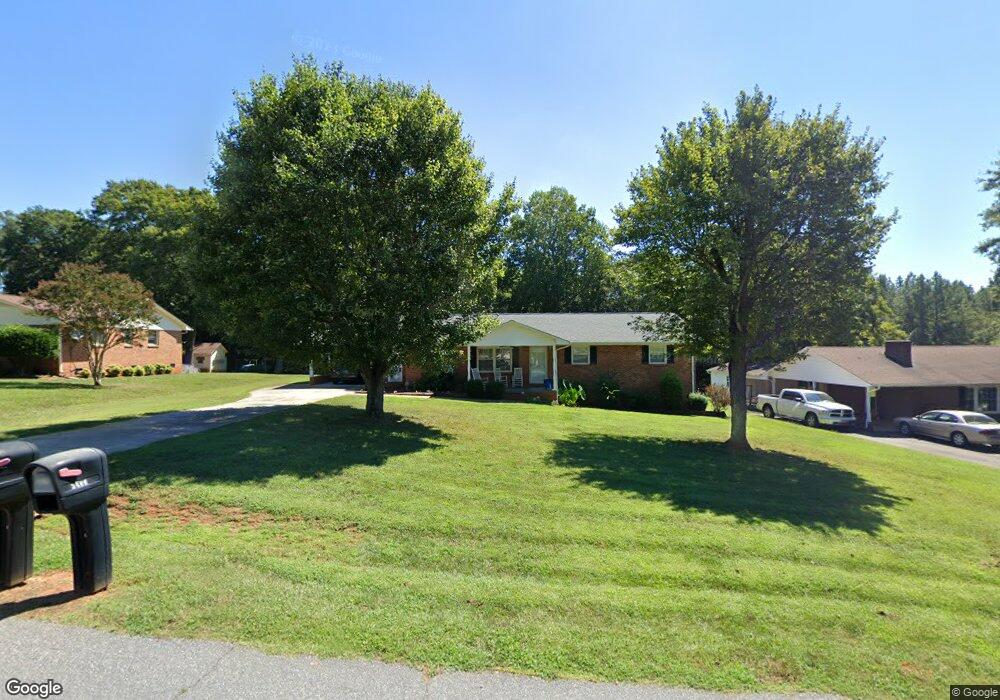
3269 Pine Tree St Lincolnton, NC 28092
Estimated Value: $282,231 - $296,000
3
Beds
2
Baths
1,482
Sq Ft
$195/Sq Ft
Est. Value
About This Home
This home is located at 3269 Pine Tree St, Lincolnton, NC 28092 and is currently estimated at $289,308, approximately $195 per square foot. 3269 Pine Tree St is a home located in Lincoln County with nearby schools including Love Memorial Elementary School, West Lincoln Middle, and West Lincoln High School.
Ownership History
Date
Name
Owned For
Owner Type
Purchase Details
Closed on
Aug 30, 2024
Sold by
Montgomery Julie Kristina Ayers and Montgomery Charle
Bought by
Alexander Joshua and Alexander Taylor Nicole
Current Estimated Value
Home Financials for this Owner
Home Financials are based on the most recent Mortgage that was taken out on this home.
Original Mortgage
$259,356
Outstanding Balance
$256,608
Interest Rate
6.78%
Mortgage Type
New Conventional
Estimated Equity
$32,700
Purchase Details
Closed on
Sep 12, 2018
Sold by
Ayers Phillip Todd and Ayers Dana L
Bought by
Ayers Phillip Todd and Montgomery Julie Kristina Ayers
Purchase Details
Closed on
Dec 15, 2015
Sold by
Ayers Phyllis P
Bought by
Ayers Phillip Todd
Purchase Details
Closed on
Feb 8, 2013
Sold by
Redus Nc All Llc
Bought by
Reo Funding Solutions Iii Llc
Purchase Details
Closed on
Aug 4, 2011
Sold by
Canyon Development Group Llc
Bought by
Redus Nc All Llc
Create a Home Valuation Report for This Property
The Home Valuation Report is an in-depth analysis detailing your home's value as well as a comparison with similar homes in the area
Home Values in the Area
Average Home Value in this Area
Purchase History
| Date | Buyer | Sale Price | Title Company |
|---|---|---|---|
| Alexander Joshua | $275,000 | None Listed On Document | |
| Ayers Phillip Todd | -- | None Available | |
| Ayers Phillip Todd | -- | None Available | |
| Reo Funding Solutions Iii Llc | $760,000 | None Available | |
| Redus Nc All Llc | $1,010,986 | None Available |
Source: Public Records
Mortgage History
| Date | Status | Borrower | Loan Amount |
|---|---|---|---|
| Open | Alexander Joshua | $259,356 |
Source: Public Records
Tax History Compared to Growth
Tax History
| Year | Tax Paid | Tax Assessment Tax Assessment Total Assessment is a certain percentage of the fair market value that is determined by local assessors to be the total taxable value of land and additions on the property. | Land | Improvement |
|---|---|---|---|---|
| 2025 | $1,616 | $236,500 | $27,000 | $209,500 |
| 2024 | $1,596 | $236,500 | $27,000 | $209,500 |
| 2023 | $1,591 | $236,500 | $27,000 | $209,500 |
| 2022 | $1,097 | $132,022 | $22,000 | $110,022 |
| 2021 | $1,097 | $132,022 | $22,000 | $110,022 |
| 2020 | $956 | $132,022 | $22,000 | $110,022 |
| 2019 | $956 | $132,022 | $22,000 | $110,022 |
| 2018 | $901 | $108,698 | $19,000 | $89,698 |
| 2017 | $800 | $108,698 | $19,000 | $89,698 |
| 2016 | $800 | $108,698 | $19,000 | $89,698 |
| 2015 | $870 | $108,698 | $19,000 | $89,698 |
| 2014 | $880 | $115,708 | $20,500 | $95,208 |
Source: Public Records
Map
Nearby Homes
- 3156 Long Shoals Rd
- 2988 Wesleyan Church Rd
- 2913 & 2901 Wesleyan Church Rd
- 2641 Southside Rd
- 511 Colorado Trail
- 3076 Gates Rd
- 155 Golden Aster Dr
- 141 Rash Rd
- 2503 Tin Mine Rd
- 864 Calloway Rd
- 848 Ike Lynch Rd
- 1509 Autumn Banks Way Unit 4p
- 1512 Autumn Banks Way
- 1512 Autumn Banks Way Unit 113
- Hudson Plan at Autumn Ridge
- Baxter Plan at Autumn Ridge
- TA3000 Plan at Autumn Ridge
- TA4000 Plan at Autumn Ridge
- Gideon Plan at Autumn Ridge
- Huntley Plan at Autumn Ridge
- 3279 Pine Tree St
- 3257 Pine Tree St
- 3289 Pine Tree St
- 3247 Pine Tree St
- 3276 Pine Tree St
- 3262 Pine Tree St
- 3239 Pine Tree St
- 3250 Pine Tree St
- 3286 Pine Tree St
- 3240 Pine Tree St
- 3229 Pine Tree St
- 763 Hoffman Rd
- 1421 Whispering Hill Trail
- 3249 Springfield Dr
- 3237 Springfield Dr
- 3228 Pine Tree St
- 1433 Whispering Hill Trail
- 1433 Whispering Hill Trail Unit 23 & 24
- 3227 Springfield Dr
- 1351 Lucy Dr