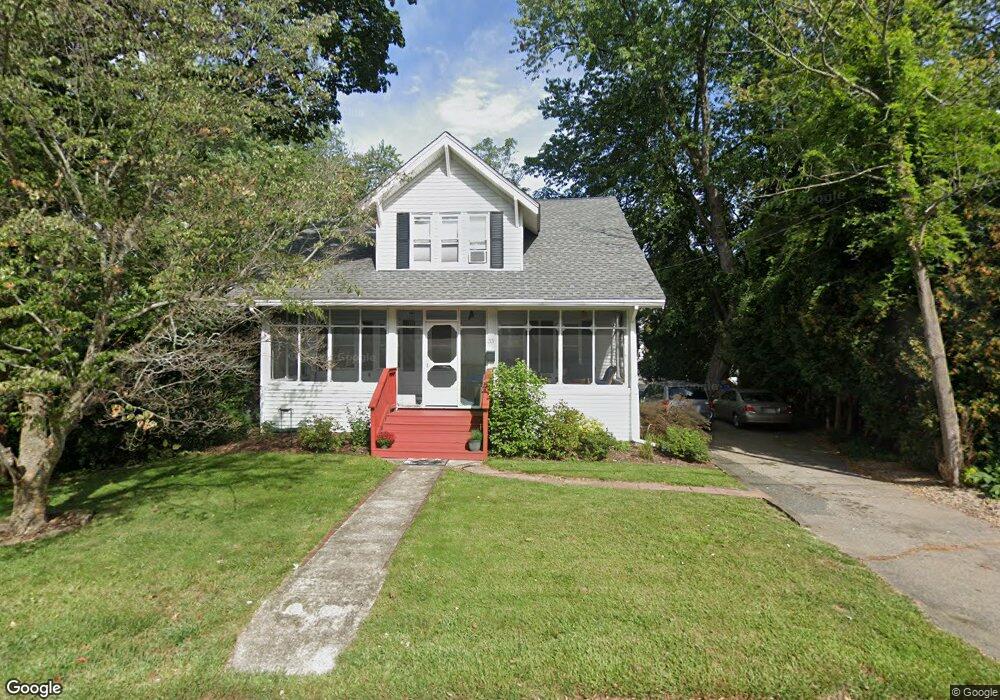
33 Cross St Franklin, MA 02038
Downtown Franklin NeighborhoodEstimated Value: $497,000 - $554,706
3
Beds
3
Baths
1,270
Sq Ft
$407/Sq Ft
Est. Value
About This Home
This home is located at 33 Cross St, Franklin, MA 02038 and is currently estimated at $516,927, approximately $407 per square foot. 33 Cross St is a home located in Norfolk County with nearby schools including Remington Middle School, Franklin High School, and Benjamin Franklin Classical Charter Public School.
Ownership History
Date
Name
Owned For
Owner Type
Purchase Details
Closed on
Jul 9, 2014
Sold by
Hayward Megan G and Poliquin Megan G
Bought by
Martin William H and Martin Katherine T
Current Estimated Value
Home Financials for this Owner
Home Financials are based on the most recent Mortgage that was taken out on this home.
Original Mortgage
$233,996
Outstanding Balance
$179,628
Interest Rate
4.37%
Mortgage Type
FHA
Estimated Equity
$337,299
Purchase Details
Closed on
Dec 30, 2005
Sold by
Campbell Brent G and Jones Michelle
Bought by
Hayward Megan G
Home Financials for this Owner
Home Financials are based on the most recent Mortgage that was taken out on this home.
Original Mortgage
$171,500
Interest Rate
6.39%
Mortgage Type
Purchase Money Mortgage
Purchase Details
Closed on
Mar 25, 2004
Sold by
Campbell Phyllis M
Bought by
Campbell Brent G and Jones Michelle
Purchase Details
Closed on
Dec 23, 1988
Sold by
Colt James M
Bought by
Campbell Phyllis M
Create a Home Valuation Report for This Property
The Home Valuation Report is an in-depth analysis detailing your home's value as well as a comparison with similar homes in the area
Home Values in the Area
Average Home Value in this Area
Purchase History
| Date | Buyer | Sale Price | Title Company |
|---|---|---|---|
| Martin William H | $195,000 | -- | |
| Hayward Megan G | $245,000 | -- | |
| Campbell Brent G | -- | -- | |
| Campbell Phyllis M | $142,000 | -- |
Source: Public Records
Mortgage History
| Date | Status | Borrower | Loan Amount |
|---|---|---|---|
| Open | Martin William H | $233,996 | |
| Previous Owner | Campbell Phyllis M | $256,000 | |
| Previous Owner | Hayward Megan G | $171,500 | |
| Previous Owner | Hayward Megan G | $73,500 |
Source: Public Records
Tax History Compared to Growth
Tax History
| Year | Tax Paid | Tax Assessment Tax Assessment Total Assessment is a certain percentage of the fair market value that is determined by local assessors to be the total taxable value of land and additions on the property. | Land | Improvement |
|---|---|---|---|---|
| 2025 | $5,788 | $498,100 | $240,500 | $257,600 |
| 2024 | $5,205 | $441,500 | $240,500 | $201,000 |
| 2023 | $5,349 | $425,200 | $242,500 | $182,700 |
| 2022 | $5,097 | $362,800 | $200,400 | $162,400 |
| 2021 | $4,769 | $325,500 | $214,700 | $110,800 |
| 2020 | $4,672 | $322,000 | $216,500 | $105,500 |
| 2019 | $4,424 | $301,800 | $196,200 | $105,600 |
| 2018 | $4,348 | $296,800 | $201,700 | $95,100 |
| 2017 | $4,084 | $280,100 | $185,000 | $95,100 |
| 2016 | $3,853 | $265,700 | $182,000 | $83,700 |
| 2015 | $3,913 | $263,700 | $177,500 | $86,200 |
| 2014 | $3,400 | $235,300 | $149,100 | $86,200 |
Source: Public Records
Map
Nearby Homes
- 40 Cross St
- 159 E Central St
- 90 E Central St Unit 103
- 90 E Central St Unit 106
- 90 E Central St Unit 304
- 90 E Central St Unit 202
- 90 E Central St Unit 105
- 90 E Central St Unit 301
- 99 Summer St
- 1 Uncas Ave
- 64 Uncas Ave
- 70 Uncas Ave
- 32 Dale St
- 82 Uncas Ave Unit 1
- 67 Milliken Ave Unit 22
- 76 Dean Ave
- 67 Cottage St
- 7 Howard Place
- 1 Pond Place
- 120 Union St Unit 1
- 33 Cross St
- 37 Cross St
- 39 Cross St
- 39 Cross St Unit 39
- 138 E Central St
- 122 E Central St
- 36 Cross St Unit 1
- 28 Cross St
- 28-30 Cross St Unit 28
- 28 Cross St Unit 28
- 30 Cross St Unit 1
- 28 Cross St Unit 1
- 34 Cross St
- 85 Cross St Unit 85
- 118 E Central St
- 44 Cross St
- 57 Cross St
- 24 Cross St
- 46 Cross St
- 46 Cross St Unit 1