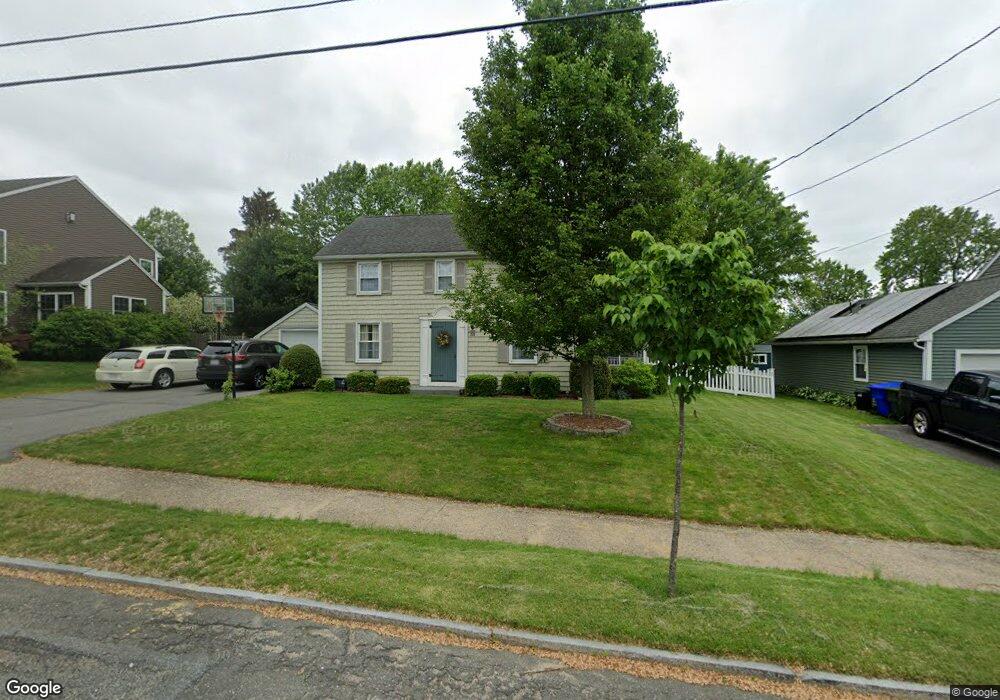
33 Kipling St Springfield, MA 01118
East Forest Park NeighborhoodEstimated Value: $409,000 - $425,000
4
Beds
3
Baths
2,004
Sq Ft
$208/Sq Ft
Est. Value
About This Home
This home is located at 33 Kipling St, Springfield, MA 01118 and is currently estimated at $416,848, approximately $208 per square foot. 33 Kipling St is a home located in Hampden County with nearby schools including Mary A. Dryden Veterans Memorial School, M Marcus Kiley Middle, and Springfield High School of Science and Technology.
Ownership History
Date
Name
Owned For
Owner Type
Purchase Details
Closed on
Nov 9, 2016
Sold by
Mcquade James G and Mcquade Ann M
Bought by
Mcquade James G and Mcquade Ann M
Current Estimated Value
Purchase Details
Closed on
Jun 19, 2012
Sold by
Mcquade James G and Mcquade Ann M
Bought by
Mcquade James G and Mcquade Ann M
Home Financials for this Owner
Home Financials are based on the most recent Mortgage that was taken out on this home.
Original Mortgage
$125,000
Interest Rate
3.85%
Mortgage Type
New Conventional
Purchase Details
Closed on
Jan 19, 1990
Sold by
Calvanese Robert J
Bought by
Mcquade James G
Home Financials for this Owner
Home Financials are based on the most recent Mortgage that was taken out on this home.
Original Mortgage
$99,000
Interest Rate
9.68%
Mortgage Type
Purchase Money Mortgage
Create a Home Valuation Report for This Property
The Home Valuation Report is an in-depth analysis detailing your home's value as well as a comparison with similar homes in the area
Home Values in the Area
Average Home Value in this Area
Purchase History
| Date | Buyer | Sale Price | Title Company |
|---|---|---|---|
| Mcquade James G | -- | -- | |
| Mcquade James G | -- | -- | |
| Mcquade James G | $149,000 | -- |
Source: Public Records
Mortgage History
| Date | Status | Borrower | Loan Amount |
|---|---|---|---|
| Previous Owner | Mcquade James G | $125,000 | |
| Previous Owner | Mcquade James G | $11,020 | |
| Previous Owner | Mcquade James G | $100,000 | |
| Previous Owner | Mcquade James G | $99,000 | |
| Previous Owner | Mcquade James G | $10,000 |
Source: Public Records
Tax History
| Year | Tax Paid | Tax Assessment Tax Assessment Total Assessment is a certain percentage of the fair market value that is determined by local assessors to be the total taxable value of land and additions on the property. | Land | Improvement |
|---|---|---|---|---|
| 2025 | $6,667 | $425,200 | $58,000 | $367,200 |
| 2024 | $6,257 | $389,600 | $58,000 | $331,600 |
| 2023 | $6,111 | $358,400 | $55,200 | $303,200 |
| 2022 | $5,941 | $315,700 | $55,200 | $260,500 |
| 2021 | $5,502 | $291,100 | $50,200 | $240,900 |
| 2020 | $5,437 | $278,400 | $50,200 | $228,200 |
| 2019 | $5,349 | $271,800 | $50,200 | $221,600 |
| 2018 | $4,820 | $244,900 | $50,200 | $194,700 |
| 2017 | $4,673 | $237,700 | $55,200 | $182,500 |
| 2016 | $4,716 | $239,900 | $55,200 | $184,700 |
| 2015 | $4,624 | $235,100 | $55,200 | $179,900 |
Source: Public Records
Map
Nearby Homes
- 384 Abbott St
- 75 Gillette Cir
- 54 S Shore Dr
- 7 Ashbrook St
- 37 Chesterfield Ave
- 509 Plumtree Rd
- 236 Pondview Dr
- 118 Pilgrim Rd
- 170 Plumtree Rd
- 134 Eddywood St
- 47 Hartford Terrace
- 79 Roosevelt Ave
- 647 Plumtree Rd
- 44 Amanda St
- 22 Amanda St
- 101 Regal St
- 309 Island Pond Rd
- 30 W Hill Rd
- 29 Eddywood St
- 1088 Sumner Ave
Your Personal Tour Guide
Ask me questions while you tour the home.