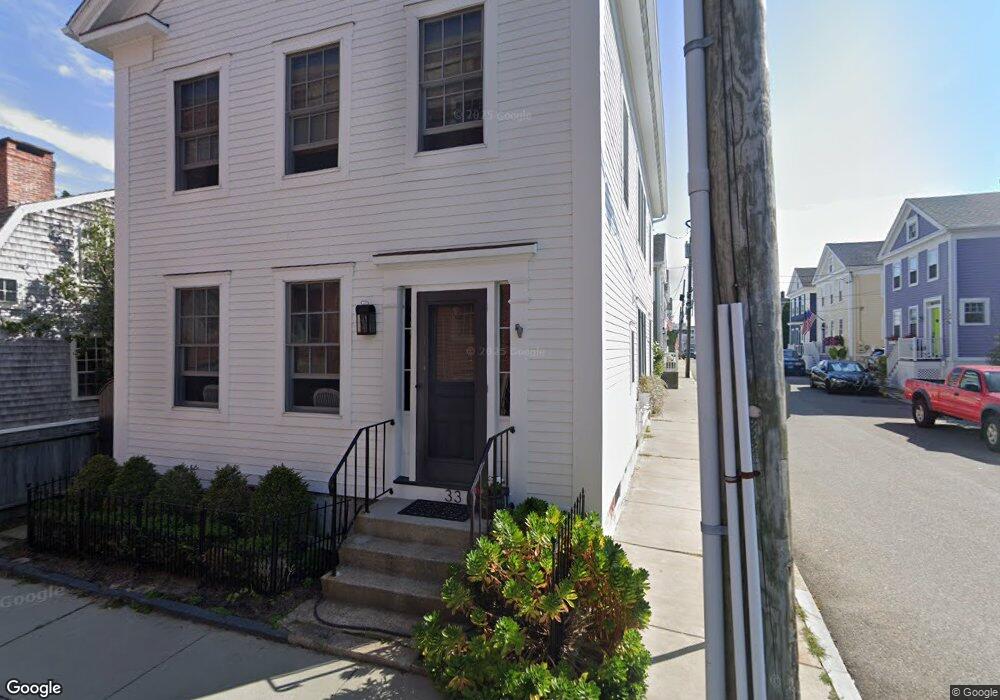
33 Water St Stonington, CT 06378
Estimated Value: $886,000 - $1,037,724
4
Beds
2
Baths
2,010
Sq Ft
$471/Sq Ft
Est. Value
About This Home
This home is located at 33 Water St, Stonington, CT 06378 and is currently estimated at $946,241, approximately $470 per square foot. 33 Water St is a home located in New London County with nearby schools including Stonington Middle School, Stonington High School, and Pine Point School.
Ownership History
Date
Name
Owned For
Owner Type
Purchase Details
Closed on
Mar 1, 2011
Sold by
Woodside Quay Llc and Redstone Quay Llc
Bought by
33 Water Llc
Current Estimated Value
Purchase Details
Closed on
Oct 14, 2005
Sold by
Young David and Young Lynn
Bought by
Woodside Quay Llc and Redstone Quay Llc
Purchase Details
Closed on
Mar 16, 2000
Sold by
Nazzaro John J
Bought by
Young David W and Young Lynn P
Purchase Details
Closed on
Aug 29, 1997
Sold by
Rezendez Thomas P
Bought by
Nazzaro John J
Home Financials for this Owner
Home Financials are based on the most recent Mortgage that was taken out on this home.
Original Mortgage
$160,000
Interest Rate
7.41%
Mortgage Type
Unknown
Create a Home Valuation Report for This Property
The Home Valuation Report is an in-depth analysis detailing your home's value as well as a comparison with similar homes in the area
Home Values in the Area
Average Home Value in this Area
Purchase History
| Date | Buyer | Sale Price | Title Company |
|---|---|---|---|
| 33 Water Llc | -- | -- | |
| 33 Water Llc | -- | -- | |
| Woodside Quay Llc | $635,000 | -- | |
| Woodside Quay Llc | $635,000 | -- | |
| Young David W | $272,500 | -- | |
| Young David W | $272,500 | -- | |
| Nazzaro John J | $200,000 | -- | |
| Nazzaro John J | $200,000 | -- |
Source: Public Records
Mortgage History
| Date | Status | Borrower | Loan Amount |
|---|---|---|---|
| Previous Owner | Nazzaro John J | $160,000 | |
| Previous Owner | Nazzaro John J | $15,000 |
Source: Public Records
Tax History Compared to Growth
Tax History
| Year | Tax Paid | Tax Assessment Tax Assessment Total Assessment is a certain percentage of the fair market value that is determined by local assessors to be the total taxable value of land and additions on the property. | Land | Improvement |
|---|---|---|---|---|
| 2025 | $11,417 | $561,200 | $323,500 | $237,700 |
| 2024 | $10,943 | $561,200 | $323,500 | $237,700 |
| 2023 | $11,028 | $561,200 | $323,500 | $237,700 |
| 2022 | $9,408 | $352,900 | $183,100 | $169,800 |
| 2021 | $9,475 | $352,900 | $183,100 | $169,800 |
| 2020 | $9,302 | $352,900 | $183,100 | $169,800 |
| 2019 | $3,417 | $352,900 | $183,100 | $169,800 |
| 2018 | $9,027 | $352,900 | $183,100 | $169,800 |
| 2017 | $8,093 | $313,300 | $158,700 | $154,600 |
| 2016 | $7,867 | $313,300 | $158,700 | $154,600 |
| 2015 | $7,525 | $313,300 | $158,700 | $154,600 |
| 2014 | $7,184 | $313,300 | $158,700 | $154,600 |
Source: Public Records
Map
Nearby Homes
- 35 Water St
- 39 Water St
- 39 Water St Unit 2
- 39 Water St Unit 4
- 39 Water St Unit 1
- 4 Trumbull St
- 00 Main St
- 3 Diving St
- 6 Trumbull St
- 32 Water St Unit 27
- 32 Water St Unit 37
- 32 Water St Unit H3
- 32 Water St Unit 14
- 32 Water St Unit 38
- 32 Water St Unit 29
- 32 Water St Unit 3
- 32 Water St
- 5 Diving St
- 31 Water St
- 8 Trumbull St