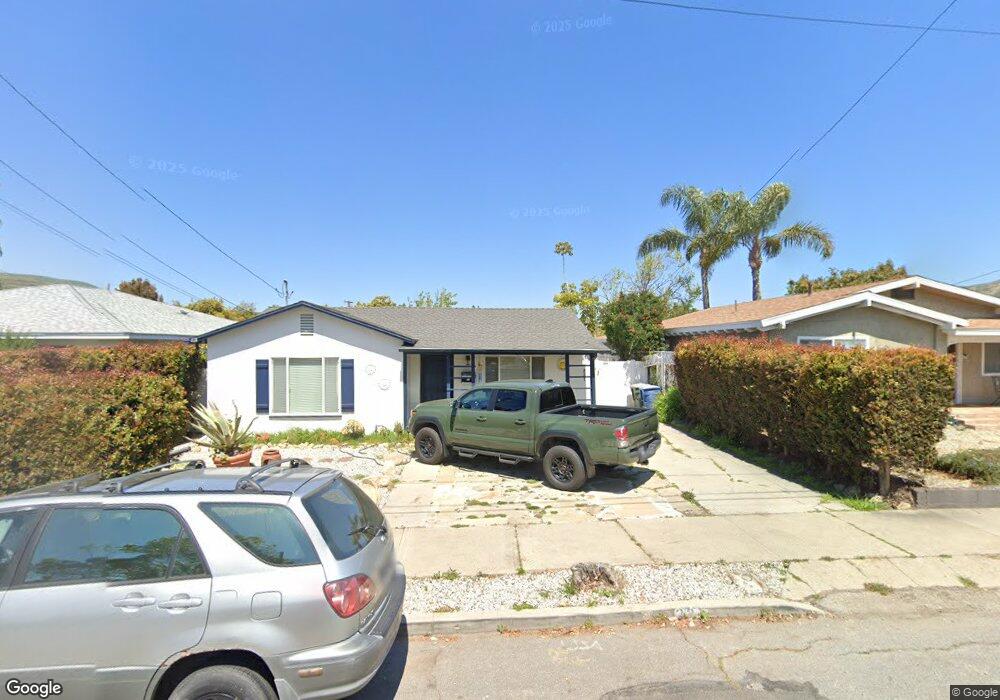
331 W Prospect St Ventura, CA 93001
Westside NeighborhoodEstimated Value: $682,000 - $814,000
2
Beds
1
Bath
813
Sq Ft
$903/Sq Ft
Est. Value
About This Home
This home is located at 331 W Prospect St, Ventura, CA 93001 and is currently estimated at $734,033, approximately $902 per square foot. 331 W Prospect St is a home located in Ventura County with nearby schools including Will Rogers Elementary School, De Anza Academy Of Technology And The Arts, and Ventura High School.
Ownership History
Date
Name
Owned For
Owner Type
Purchase Details
Closed on
Sep 8, 2015
Sold by
Schreiner Matthew D
Bought by
Helland Enriqueta and Helland Robjorn
Current Estimated Value
Home Financials for this Owner
Home Financials are based on the most recent Mortgage that was taken out on this home.
Original Mortgage
$319,200
Outstanding Balance
$250,282
Interest Rate
3.86%
Mortgage Type
New Conventional
Estimated Equity
$483,751
Purchase Details
Closed on
Mar 14, 2008
Sold by
Curren John M and Curren Patricia J
Bought by
Schreiner Matthew D
Home Financials for this Owner
Home Financials are based on the most recent Mortgage that was taken out on this home.
Original Mortgage
$191,250
Interest Rate
6.22%
Mortgage Type
Purchase Money Mortgage
Create a Home Valuation Report for This Property
The Home Valuation Report is an in-depth analysis detailing your home's value as well as a comparison with similar homes in the area
Home Values in the Area
Average Home Value in this Area
Purchase History
| Date | Buyer | Sale Price | Title Company |
|---|---|---|---|
| Helland Enriqueta | $399,000 | Pacific Coast Title Company | |
| Schreiner Matthew D | $225,000 | First American Title Company |
Source: Public Records
Mortgage History
| Date | Status | Borrower | Loan Amount |
|---|---|---|---|
| Open | Helland Enriqueta | $319,200 | |
| Previous Owner | Schreiner Matthew D | $191,250 |
Source: Public Records
Tax History Compared to Growth
Tax History
| Year | Tax Paid | Tax Assessment Tax Assessment Total Assessment is a certain percentage of the fair market value that is determined by local assessors to be the total taxable value of land and additions on the property. | Land | Improvement |
|---|---|---|---|---|
| 2025 | $5,143 | $576,366 | $307,192 | $269,174 |
| 2024 | $5,143 | $463,065 | $301,168 | $161,897 |
| 2023 | $5,081 | $453,986 | $295,263 | $158,723 |
| 2022 | $4,732 | $445,085 | $289,474 | $155,611 |
| 2021 | $4,642 | $436,358 | $283,798 | $152,560 |
| 2020 | $4,598 | $431,886 | $280,889 | $150,997 |
| 2019 | $4,513 | $423,419 | $275,382 | $148,037 |
| 2018 | $4,439 | $415,118 | $269,983 | $145,135 |
| 2017 | $4,346 | $406,980 | $264,690 | $142,290 |
| 2016 | $4,261 | $399,000 | $259,500 | $139,500 |
| 2015 | $2,676 | $245,898 | $158,469 | $87,429 |
| 2014 | $2,633 | $241,083 | $155,366 | $85,717 |
Source: Public Records
Map
Nearby Homes
- 367 W Harrison Ave
- 295 W Mission Ave
- 326 W Mission Ave
- 657 Sheridan Way
- 467 W Simpson St
- 557 561 N North Olive St
- 285 N Ventura Ave Unit 5
- 285 N Ventura Ave Unit 6
- 885 Riverside St
- 323 Wall St
- 100 E Center St
- 130 N Garden St Unit 3248
- 257 Cedar St
- 281 W Main St
- 49 Mission Plaza Dr Unit 30
- 0 Cedar St Unit PW25039713
- 104 W Santa Clara St Unit 16
- 436 Poli St Unit 404
- 216 E Lewis St
- 47 W Mcfarlane Dr
- 325 W Prospect St
- 345 W Prospect St
- 355 W Prospect St
- 317 W Prospect St
- 340 W Center St
- 330 W Center St
- 361 W Prospect St
- 346 W Center St
- 324 W Center St
- 305 W Prospect St
- 316 W Center St
- 369 W Prospect St
- 338 W Prospect St Unit 6
- 338 W Prospect St
- 344 W Prospect St
- 324 W Prospect St
- 502 Sheridan Way Unit 2
- 502 Sheridan Way
- 306 W Center St
- 293 W Prospect St