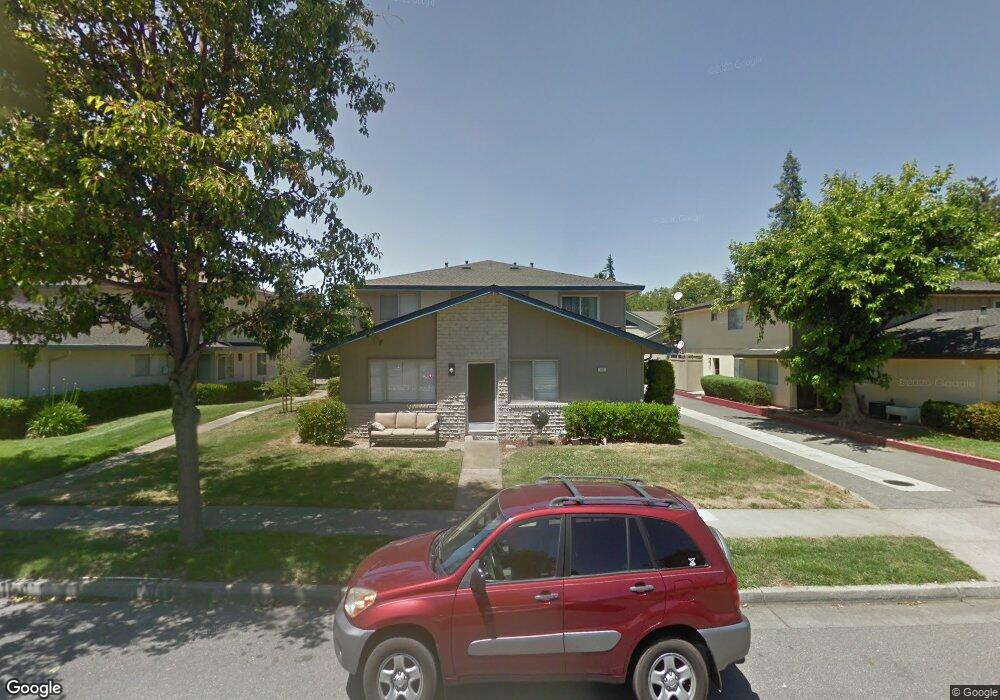
335 N 3rd St Unit 1 Campbell, CA 95008
Downtown Campbell NeighborhoodEstimated Value: $612,854 - $895,000
2
Beds
1
Bath
810
Sq Ft
$894/Sq Ft
Est. Value
About This Home
This home is located at 335 N 3rd St Unit 1, Campbell, CA 95008 and is currently estimated at $723,964, approximately $893 per square foot. 335 N 3rd St Unit 1 is a home located in Santa Clara County with nearby schools including Rosemary Elementary School, Del Mar High School, and Campbell School of Innovation.
Ownership History
Date
Name
Owned For
Owner Type
Purchase Details
Closed on
Mar 19, 2025
Sold by
Tran Hong D
Bought by
Hong D Tran Living Trust and Tran
Current Estimated Value
Purchase Details
Closed on
Feb 3, 2010
Sold by
Tonna Marilyn
Bought by
Tran Hong D
Home Financials for this Owner
Home Financials are based on the most recent Mortgage that was taken out on this home.
Original Mortgage
$269,000
Interest Rate
5.11%
Mortgage Type
New Conventional
Purchase Details
Closed on
Dec 3, 2009
Sold by
Brown Adele R
Bought by
Brown Adele R
Purchase Details
Closed on
May 3, 2007
Sold by
Brown Adele R
Bought by
Brown Adele R
Home Financials for this Owner
Home Financials are based on the most recent Mortgage that was taken out on this home.
Original Mortgage
$200,000
Interest Rate
6.62%
Mortgage Type
New Conventional
Purchase Details
Closed on
Aug 11, 1994
Sold by
Brown Adele R
Bought by
Brown Adele R
Create a Home Valuation Report for This Property
The Home Valuation Report is an in-depth analysis detailing your home's value as well as a comparison with similar homes in the area
Home Values in the Area
Average Home Value in this Area
Purchase History
| Date | Buyer | Sale Price | Title Company |
|---|---|---|---|
| Hong D Tran Living Trust | -- | None Listed On Document | |
| Tran Hong D | $299,000 | Old Republic Title Company | |
| Brown Adele R | -- | None Available | |
| Brown Adele R | -- | Stewart Title Of Ca Inc | |
| Brown Adele R | -- | Stewart Title Of Ca Inc | |
| Brown Adele R | -- | -- |
Source: Public Records
Mortgage History
| Date | Status | Borrower | Loan Amount |
|---|---|---|---|
| Previous Owner | Tran Hong D | $269,000 | |
| Previous Owner | Brown Adele R | $200,000 |
Source: Public Records
Tax History
| Year | Tax Paid | Tax Assessment Tax Assessment Total Assessment is a certain percentage of the fair market value that is determined by local assessors to be the total taxable value of land and additions on the property. | Land | Improvement |
|---|---|---|---|---|
| 2025 | $5,401 | $385,938 | $192,969 | $192,969 |
| 2024 | $5,401 | $378,372 | $189,186 | $189,186 |
| 2023 | $5,401 | $370,954 | $185,477 | $185,477 |
| 2022 | $5,348 | $363,682 | $181,841 | $181,841 |
| 2021 | $5,236 | $356,552 | $178,276 | $178,276 |
| 2020 | $5,090 | $352,896 | $176,448 | $176,448 |
| 2019 | $5,005 | $345,978 | $172,989 | $172,989 |
| 2018 | $4,844 | $339,196 | $169,598 | $169,598 |
| 2017 | $4,762 | $332,546 | $166,273 | $166,273 |
| 2016 | $4,471 | $326,026 | $163,013 | $163,013 |
| 2015 | $4,375 | $321,130 | $160,565 | $160,565 |
| 2014 | $4,169 | $314,840 | $157,420 | $157,420 |
Source: Public Records
Map
Nearby Homes
- 283 Esther Ave
- 350 N 1st St Unit 3
- 1481 Pompey Dr
- 1454 Merry Ln
- 77 S 1st St
- 110 S 1st St Unit 110
- 87 Salice Way
- 3364 Merrimac Dr
- 466 Sam Cava Ln
- 289 Llewellyn Ave Unit 18-18 - Plan 1
- 289 Llewellyn Ave Unit 17-18 - Plan 2
- 285 Llewellyn Ave Unit 16-18 Plan 2
- 281 Llewellyn Ave Unit 14-18 - Plan 2
- 271 Wagon Way Unit 38-03 - Plan 4
- 273 Llewellyn Ave Unit 10-18 Plan 2
- 291 Wagon Way Unit 28-02 - Plan 6
- 289 Wagon Way Unit 27-02 - Plan 2
- 289 Wagon Way Unit 29-02 - Plan 3
- 287 Wagon Way Unit 30-02 Plan 4
- 283 Wagon Way Unit 32-02 Plan 5
- 335 N 3rd St Unit 4
- 335 N 3rd St Unit 3
- 335 N 3rd St Unit 2
- 345 N 3rd St Unit 4
- 345 N 3rd St Unit 3
- 345 N 3rd St Unit 2
- 345 N 3rd St Unit 1
- 325 N 3rd St Unit 3
- 325 N 3rd St Unit 2
- 325 N 3rd St Unit 1
- 346 Esther Ave
- 355 N 3rd St Unit 3
- 355 N 3rd St Unit 4
- 355 N 3rd St Unit 3
- 355 N 3rd St Unit 2
- 355 N 3rd St Unit 1
- 356 Esther Ave
- 336 Esther Ave
- 315 N 3rd St Unit 1
- 315 N 3rd St Unit 4
Your Personal Tour Guide
Ask me questions while you tour the home.