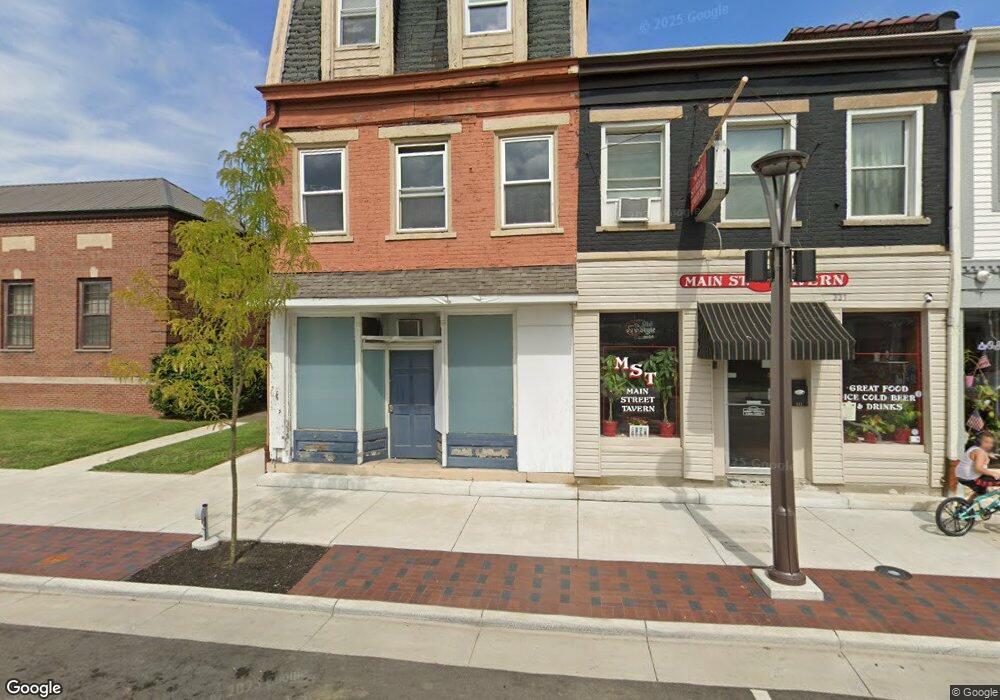
335 S Main St Franklin, OH 45005
Estimated Value: $172,899
Studio
--
Bath
3,894
Sq Ft
$44/Sq Ft
Est. Value
About This Home
This home is located at 335 S Main St, Franklin, OH 45005 and is currently estimated at $172,899, approximately $44 per square foot. 335 S Main St is a home located in Warren County with nearby schools including Franklin High School.
Ownership History
Date
Name
Owned For
Owner Type
Purchase Details
Closed on
Apr 22, 2021
Sold by
Mj Holdings Llc
Bought by
City Of Franklin
Current Estimated Value
Purchase Details
Closed on
Jan 20, 2020
Sold by
Franklin Cityof
Bought by
Mj Holding Llc
Purchase Details
Closed on
Mar 18, 2014
Sold by
Gates Wade and Gates Kristi L
Bought by
City Of Franklin
Purchase Details
Closed on
Aug 26, 2004
Sold by
Pumphry Dolores G and Benbow David
Bought by
Gates Wade and Vaughn Dale A
Home Financials for this Owner
Home Financials are based on the most recent Mortgage that was taken out on this home.
Original Mortgage
$116,000
Interest Rate
6.08%
Mortgage Type
Commercial
Purchase Details
Closed on
Jul 1, 1992
Sold by
Evans Evans and Evans Martha Elaine
Bought by
Mcguire Mcguire and Mcguire Donald R
Purchase Details
Closed on
Jun 9, 1980
Sold by
Oren Evans and Oren George
Create a Home Valuation Report for This Property
The Home Valuation Report is an in-depth analysis detailing your home's value as well as a comparison with similar homes in the area
Home Values in the Area
Average Home Value in this Area
Purchase History
| Date | Buyer | Sale Price | Title Company |
|---|---|---|---|
| City Of Franklin | -- | None Available | |
| Mj Holding Llc | -- | None Available | |
| City Of Franklin | $80,000 | None Available | |
| Gates Wade | $145,000 | -- | |
| Mcguire Mcguire | $120,000 | -- | |
| -- | -- | -- |
Source: Public Records
Mortgage History
| Date | Status | Borrower | Loan Amount |
|---|---|---|---|
| Previous Owner | Gates Wade | $116,000 |
Source: Public Records
Tax History
| Year | Tax Paid | Tax Assessment Tax Assessment Total Assessment is a certain percentage of the fair market value that is determined by local assessors to be the total taxable value of land and additions on the property. | Land | Improvement |
|---|---|---|---|---|
| 2025 | $1,669 | $29,780 | $5,100 | $24,680 |
| 2024 | $1,669 | $29,780 | $5,100 | $24,680 |
| 2023 | $1,677 | $27,072 | $4,637 | $22,435 |
| 2022 | $1,692 | $27,073 | $4,638 | $22,435 |
| 2021 | $1,624 | $27,073 | $4,638 | $22,435 |
| 2020 | $854 | $27,073 | $4,638 | $22,435 |
| 2019 | $854 | $27,073 | $4,638 | $22,435 |
| 2018 | $0 | $27,073 | $4,638 | $22,435 |
| 2017 | $0 | $27,073 | $4,638 | $22,435 |
| 2016 | $0 | $27,073 | $4,638 | $22,435 |
| 2015 | $854 | $27,073 | $4,638 | $22,435 |
| 2014 | $1,686 | $27,070 | $4,640 | $22,440 |
| 2013 | $2,681 | $49,510 | $4,640 | $44,870 |
Source: Public Records
Map
Nearby Homes
Your Personal Tour Guide
Ask me questions while you tour the home.