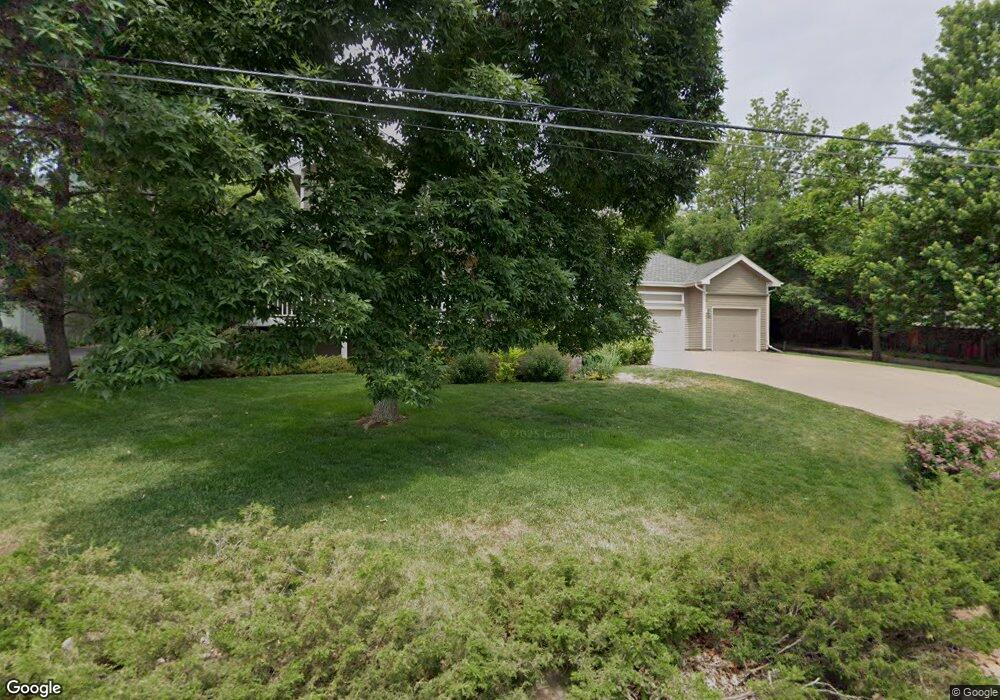
3403 4th St Boulder, CO 80304
Newlands NeighborhoodEstimated Value: $3,003,000 - $4,085,000
4
Beds
3
Baths
3,324
Sq Ft
$1,016/Sq Ft
Est. Value
About This Home
This home is located at 3403 4th St, Boulder, CO 80304 and is currently estimated at $3,377,672, approximately $1,016 per square foot. 3403 4th St is a home located in Boulder County with nearby schools including Foothill Elementary School, Centennial Middle School, and Boulder High School.
Ownership History
Date
Name
Owned For
Owner Type
Purchase Details
Closed on
Mar 10, 2026
Sold by
Stephanie M Corotis Trust and Corotis Ross B
Bought by
Ross B Corotis Revocable Trust
Current Estimated Value
Purchase Details
Closed on
Sep 26, 2023
Sold by
Corotis Stephanie M and Corotis Ross B
Bought by
Stephanie M Corotis Revocable Trust and Ross B Corotis Revocable Trust
Purchase Details
Closed on
Sep 1, 1994
Sold by
Fraser James B and Fraser Aleene S
Bought by
Corotis Stephanie M
Home Financials for this Owner
Home Financials are based on the most recent Mortgage that was taken out on this home.
Original Mortgage
$325,000
Interest Rate
7%
Purchase Details
Closed on
Oct 7, 1991
Bought by
Corotis Stephanie M and Corotis Ross B
Purchase Details
Closed on
Aug 15, 1991
Bought by
Corotis Stephanie M and Corotis Ross B
Purchase Details
Closed on
Apr 3, 1990
Bought by
Corotis Stephanie M and Corotis Ross B
Create a Home Valuation Report for This Property
The Home Valuation Report is an in-depth analysis detailing your home's value as well as a comparison with similar homes in the area
Home Values in the Area
Average Home Value in this Area
Purchase History
| Date | Buyer | Sale Price | Title Company |
|---|---|---|---|
| Ross B Corotis Revocable Trust | -- | None Listed On Document | |
| Stephanie M Corotis Revocable Trust | $500 | None Listed On Document | |
| Corotis Stephanie M | $625,000 | -- | |
| Corotis Stephanie M | -- | -- | |
| Corotis Stephanie M | $400,000 | -- | |
| Corotis Stephanie M | -- | -- |
Source: Public Records
Mortgage History
| Date | Status | Borrower | Loan Amount |
|---|---|---|---|
| Previous Owner | Corotis Stephanie M | $325,000 |
Source: Public Records
Tax History
| Year | Tax Paid | Tax Assessment Tax Assessment Total Assessment is a certain percentage of the fair market value that is determined by local assessors to be the total taxable value of land and additions on the property. | Land | Improvement |
|---|---|---|---|---|
| 2025 | $21,203 | $220,731 | $157,675 | $63,056 |
| 2024 | $21,203 | $220,731 | $157,675 | $63,056 |
| 2023 | $20,835 | $247,960 | $174,113 | $77,532 |
| 2022 | $17,677 | $197,304 | $121,618 | $75,686 |
| 2021 | $16,856 | $202,982 | $125,118 | $77,864 |
| 2020 | $13,070 | $157,301 | $121,908 | $35,393 |
| 2019 | $14,067 | $171,272 | $121,908 | $49,364 |
| 2018 | $11,878 | $144,202 | $96,048 | $48,154 |
| 2017 | $11,506 | $159,422 | $106,186 | $53,236 |
| 2016 | $8,972 | $111,607 | $71,003 | $40,604 |
| 2015 | $8,496 | $91,070 | $33,193 | $57,877 |
| 2014 | $6,988 | $91,070 | $33,193 | $57,877 |
Source: Public Records
Map
Nearby Homes
- 3421 4th St
- 440 Japonica Way
- 497 Kalmia Ave
- 503 Hawthorn Ave
- 521 Hawthorn Ave
- 503 Kalmia Ave
- 656 Juniper Ave
- 706 Juniper Ave
- 640 Iris Ave
- 701 Kalmia Ave
- 3735 Wild Plum Ct
- 300 Forest Ave
- 3716 Wonderland Hill Ave
- 495 S Cedar Brook Rd
- 3189 5th St
- 855 Kalmia Ave
- 865 Kalmia Ave
- 3150 5th St
- 865 Grape Ave Unit X
- 910 Kalmia Ave
Your Personal Tour Guide
Ask me questions while you tour the home.