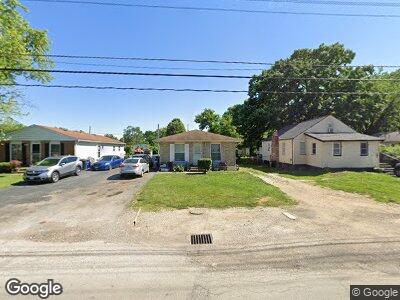
3409 E Deshler Ave Columbus, OH 43227
Linwood NeighborhoodEstimated Value: $183,715 - $218,000
3
Beds
1
Bath
1,152
Sq Ft
$180/Sq Ft
Est. Value
About This Home
This home is located at 3409 E Deshler Ave, Columbus, OH 43227 and is currently estimated at $206,929, approximately $179 per square foot. 3409 E Deshler Ave is a home located in Franklin County with nearby schools including Scottwood Elementary School, Johnson Park Middle School, and Walnut Ridge High School.
Ownership History
Date
Name
Owned For
Owner Type
Purchase Details
Closed on
Jul 13, 2005
Sold by
Estate Of Carl Sunderland
Bought by
Sunderland Karl and Sunderland Scherrie
Current Estimated Value
Home Financials for this Owner
Home Financials are based on the most recent Mortgage that was taken out on this home.
Original Mortgage
$99,750
Outstanding Balance
$63,320
Interest Rate
8.45%
Mortgage Type
Fannie Mae Freddie Mac
Estimated Equity
$141,689
Purchase Details
Closed on
Jul 7, 2005
Sold by
Sunderland Scherrie and Sunderland Esther
Bought by
Sunderland Karl
Home Financials for this Owner
Home Financials are based on the most recent Mortgage that was taken out on this home.
Original Mortgage
$99,750
Outstanding Balance
$63,320
Interest Rate
8.45%
Mortgage Type
Fannie Mae Freddie Mac
Estimated Equity
$141,689
Purchase Details
Closed on
Feb 27, 1999
Sold by
Sunderland Malcoma
Bought by
Sunderland Carl
Purchase Details
Closed on
Jan 16, 1976
Bought by
Sunderland Malcoma
Create a Home Valuation Report for This Property
The Home Valuation Report is an in-depth analysis detailing your home's value as well as a comparison with similar homes in the area
Home Values in the Area
Average Home Value in this Area
Purchase History
| Date | Buyer | Sale Price | Title Company |
|---|---|---|---|
| Sunderland Karl | -- | -- | |
| Sunderland Karl | -- | -- | |
| Sunderland Carl | -- | -- | |
| Sunderland Malcoma | -- | -- |
Source: Public Records
Mortgage History
| Date | Status | Borrower | Loan Amount |
|---|---|---|---|
| Open | Sunderland Karl | $99,750 |
Source: Public Records
Tax History Compared to Growth
Tax History
| Year | Tax Paid | Tax Assessment Tax Assessment Total Assessment is a certain percentage of the fair market value that is determined by local assessors to be the total taxable value of land and additions on the property. | Land | Improvement |
|---|---|---|---|---|
| 2024 | $2,236 | $48,800 | $14,040 | $34,760 |
| 2023 | $2,208 | $48,790 | $14,035 | $34,755 |
| 2022 | $1,655 | $31,150 | $7,420 | $23,730 |
| 2021 | $1,658 | $31,150 | $7,420 | $23,730 |
| 2020 | $1,661 | $31,150 | $7,420 | $23,730 |
| 2019 | $1,611 | $25,910 | $6,200 | $19,710 |
| 2018 | $1,531 | $25,910 | $6,200 | $19,710 |
| 2017 | $1,611 | $25,910 | $6,200 | $19,710 |
| 2016 | $1,596 | $23,490 | $4,380 | $19,110 |
| 2015 | $1,453 | $23,490 | $4,380 | $19,110 |
| 2014 | $1,456 | $23,490 | $4,380 | $19,110 |
| 2013 | $799 | $26,110 | $4,865 | $21,245 |
Source: Public Records
Map
Nearby Homes
- 3325 E Deshler Ave
- 3210 E Deshler Ave
- 1712 Courtright Rd
- 1817 Alcoy Dr
- 1626 Zettler Rd
- 1470 Byron Ave
- 1371 Aven Dr
- 3600 Cushing Dr
- 1727 Niagara Rd
- 3457 Petzinger Rd
- 1314 S Weyant Ave
- 3084 Clermont Rd
- 1850 Bostwick Rd
- 2957 Ivanhoe Dr
- 2068 Easthaven Dr
- 2126 Rochelle Place
- 2894 Langfield Dr
- 1782 Newfield Rd
- 2894 Landon Dr
- 3038 Wadsworth Ct
- 3409 E Deshler Ave
- 3415 E Deshler Ave
- 3421 E Deshler Ave
- 3395 E Deshler Ave
- 3425 E Deshler Ave
- 3387 E Deshler Ave
- 3414 Binbrook Rd N
- 3420 Binbrook Rd N
- 3428 Binbrook Rd N
- 3408 Binbrook Rd N
- 3434 Binbrook Rd N
- 3402 Binbrook Rd N
- 3431 E Deshler Ave
- 3379 E Deshler Ave
- 3440 Binbrook Rd N
- 3394 Binbrook Rd N
- 3408 E Deshler Ave
- 3422 E Deshler Ave
- 3390 E Deshler Ave
- 3396 E Deshler Ave