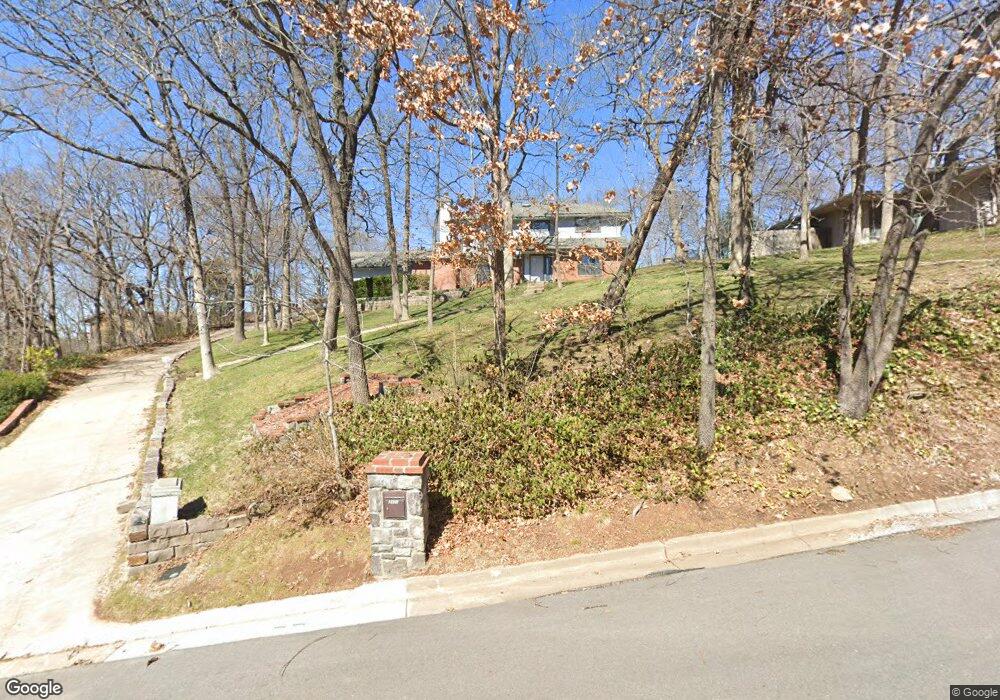
3437 E 76th St Tulsa, OK 74136
Southridge Estates NeighborhoodEstimated Value: $342,083 - $401,000
Studio
2
Baths
2,419
Sq Ft
$157/Sq Ft
Est. Value
About This Home
This home is located at 3437 E 76th St, Tulsa, OK 74136 and is currently estimated at $379,771, approximately $156 per square foot. 3437 E 76th St is a home located in Tulsa County with nearby schools including Jenks Middle School, Jenks West Intermediate Elementary School, and Jenks High School.
Ownership History
Date
Name
Owned For
Owner Type
Purchase Details
Closed on
Mar 1, 2013
Sold by
Lawson Gerri A
Bought by
Lawson Terry L and Lawson Gerri A
Current Estimated Value
Home Financials for this Owner
Home Financials are based on the most recent Mortgage that was taken out on this home.
Original Mortgage
$140,800
Outstanding Balance
$26,232
Interest Rate
3.59%
Mortgage Type
New Conventional
Estimated Equity
$353,539
Purchase Details
Closed on
Sep 5, 2003
Sold by
Lawson Terry L and Lawson Gerri A
Bought by
Lawson Gerri A and Gerri A Lawson Living Trust
Home Financials for this Owner
Home Financials are based on the most recent Mortgage that was taken out on this home.
Original Mortgage
$136,500
Interest Rate
6.01%
Mortgage Type
Purchase Money Mortgage
Purchase Details
Closed on
Feb 20, 2001
Sold by
Lawson Terry L and Lawson Gerri A
Bought by
Lawson Gerry A and The Gerri A Lawson Living Trust
Purchase Details
Closed on
Feb 1, 1993
Purchase Details
Closed on
Aug 1, 1992
Purchase Details
Closed on
Aug 1, 1991
Create a Home Valuation Report for This Property
The Home Valuation Report is an in-depth analysis detailing your home's value as well as a comparison with similar homes in the area
Home Values in the Area
Average Home Value in this Area
Purchase History
| Date | Buyer | Sale Price | Title Company |
|---|---|---|---|
| Lawson Terry L | -- | Chicago Title Serviceslink D | |
| Lawson Gerri A | -- | Firstitle & Abstract Svcs In | |
| Lawson Gerri A | -- | Firstitle & Abstract Svcs In | |
| Lawson Gerry A | -- | -- | |
| -- | $140,000 | -- | |
| -- | $12,000 | -- | |
| -- | $15,000 | -- |
Source: Public Records
Mortgage History
| Date | Status | Borrower | Loan Amount |
|---|---|---|---|
| Open | Lawson Terry L | $140,800 | |
| Previous Owner | Lawson Gerri A | $136,500 |
Source: Public Records
Tax History
| Year | Tax Paid | Tax Assessment Tax Assessment Total Assessment is a certain percentage of the fair market value that is determined by local assessors to be the total taxable value of land and additions on the property. | Land | Improvement |
|---|---|---|---|---|
| 2025 | $3,674 | $25,990 | $2,833 | $23,157 |
| 2024 | $3,254 | $25,204 | $3,319 | $21,885 |
| 2023 | $3,254 | $25,440 | $3,130 | $22,310 |
| 2022 | $3,254 | $23,699 | $3,990 | $19,709 |
| 2021 | $3,199 | $22,980 | $3,869 | $19,111 |
| 2020 | $3,131 | $22,980 | $3,869 | $19,111 |
| 2019 | $3,238 | $22,980 | $3,869 | $19,111 |
| 2018 | $3,235 | $22,980 | $3,869 | $19,111 |
| 2017 | $3,159 | $23,980 | $4,037 | $19,943 |
| 2016 | $3,156 | $23,865 | $4,018 | $19,847 |
| 2015 | $3,117 | $23,980 | $4,037 | $19,943 |
| 2014 | $3,014 | $22,495 | $4,037 | $18,458 |
Source: Public Records
Map
Nearby Homes
- 3526 E 75th St
- 3333 E 77th Place
- 3811 E 74th St
- 7455 S Sleepy Hollow Dr
- 7404 S Indianapolis Ave
- 7426 S Gary Place
- 7833 S Harvard Ave
- 7201 S Gary Place Unit 9
- 7240 S Gary Ave Unit 3
- 7310 S College Place
- 4224 E 74th St
- 4207 E 78th St
- 3111 E 78th Place
- 3620 E 70th Place
- 3124 E 79th St
- 3116 E 71st St
- 4317 E 76th St
- 2936 E 75th St
- 3208 E 80th Place
- 8131 S Jamestown Ave
- 3427 E 76th St
- 3447 E 76th St
- 3460 E 75th Place
- 3452 E 75th Place
- 3440 E 76th St
- 3430 E 76th St
- 3417 E 76th St
- 3420 E 76th St
- 7531 S Knoxville Ave
- 7521 S Knoxville Ave
- 3409 E 76th St
- 3460 E 76th St
- 3455 E 75th Place
- null E 76th St
- 7511 S Knoxville Ave
- 3434 E 75th Place
- 3471 E 75th Place
- 3445 E 75th Place
- 3410 E 76th St
- 3437 E 75th Place
Your Personal Tour Guide
Ask me questions while you tour the home.