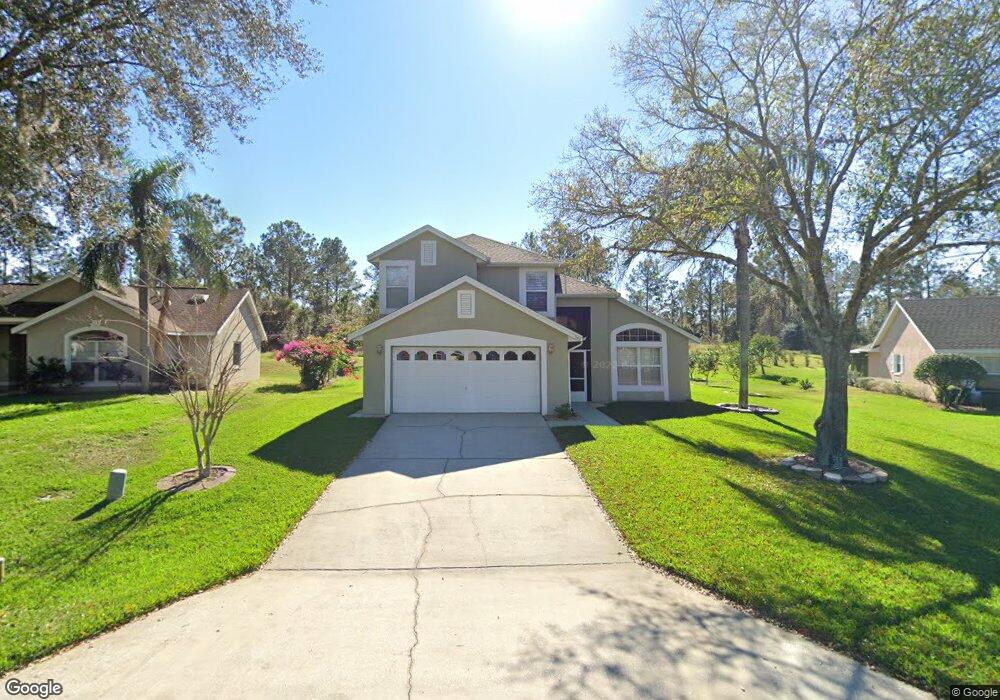
344 Nevada Loop Rd Davenport, FL 33897
Westside NeighborhoodEstimated Value: $411,093 - $429,000
4
Beds
3
Baths
2,112
Sq Ft
$199/Sq Ft
Est. Value
About This Home
This home is located at 344 Nevada Loop Rd, Davenport, FL 33897 and is currently estimated at $420,523, approximately $199 per square foot. 344 Nevada Loop Rd is a home located in Polk County with nearby schools including Citrus Ridge Academy: a Civics Academy, Davenport School Of The Arts, and Dundee Elementary Academy.
Ownership History
Date
Name
Owned For
Owner Type
Purchase Details
Closed on
Aug 7, 2002
Sold by
Hall Leslie G
Bought by
Bishop Robert W and Bishop Diane F
Current Estimated Value
Home Financials for this Owner
Home Financials are based on the most recent Mortgage that was taken out on this home.
Original Mortgage
$100,000
Outstanding Balance
$42,254
Interest Rate
6.53%
Mortgage Type
New Conventional
Estimated Equity
$378,269
Purchase Details
Closed on
Jun 28, 2001
Sold by
Cagan Isadore
Bought by
Hall Leslie G and Hall Jayne M
Home Financials for this Owner
Home Financials are based on the most recent Mortgage that was taken out on this home.
Original Mortgage
$135,600
Interest Rate
7.14%
Purchase Details
Closed on
Oct 22, 1993
Sold by
Jaymark Bldrs & Dev Inc
Bought by
Walbrecht Bette M
Home Financials for this Owner
Home Financials are based on the most recent Mortgage that was taken out on this home.
Original Mortgage
$109,500
Interest Rate
7.03%
Create a Home Valuation Report for This Property
The Home Valuation Report is an in-depth analysis detailing your home's value as well as a comparison with similar homes in the area
Home Values in the Area
Average Home Value in this Area
Purchase History
| Date | Buyer | Sale Price | Title Company |
|---|---|---|---|
| Bishop Robert W | $185,000 | -- | |
| Hall Leslie G | $169,500 | -- | |
| Walbrecht Bette M | $137,800 | -- |
Source: Public Records
Mortgage History
| Date | Status | Borrower | Loan Amount |
|---|---|---|---|
| Open | Hall Leslie G | $100,000 | |
| Previous Owner | Hall Leslie G | $135,600 | |
| Previous Owner | Hall Leslie G | $50,000 | |
| Previous Owner | Walbrecht Bette M | $109,500 |
Source: Public Records
Tax History
| Year | Tax Paid | Tax Assessment Tax Assessment Total Assessment is a certain percentage of the fair market value that is determined by local assessors to be the total taxable value of land and additions on the property. | Land | Improvement |
|---|---|---|---|---|
| 2025 | $4,823 | $339,595 | -- | -- |
| 2024 | $4,489 | $308,723 | -- | -- |
| 2023 | $4,489 | $280,657 | $0 | $0 |
| 2022 | $4,057 | $255,143 | $0 | $0 |
| 2021 | $3,663 | $231,948 | $40,000 | $191,948 |
| 2020 | $3,526 | $224,784 | $38,000 | $186,784 |
| 2018 | $3,123 | $188,150 | $36,000 | $152,150 |
| 2017 | $2,895 | $173,624 | $0 | $0 |
| 2016 | $2,709 | $158,066 | $0 | $0 |
Source: Public Records
Map
Nearby Homes
- 406 Nevada Loop Rd
- 234 Montana Ave
- 440 Langham Dr
- 314 Casterton Cir
- 527 Durango Loop St
- 202 Casterton Cir
- 242 Durango Loop St
- 159 Grosvenor Loop
- 221 Grosvenor Loop
- 207 Langham Dr
- 118 Steamboat Blvd
- 135 Langham Dr
- 148 Grosvenor Loop
- 143 Santana Place
- 142 Santana Place
- 844 Casterton Cir
- 134 Dillon Way
- 134 Langham Dr
- 114 Langham Dr
- 1143 Casterton Cir
- 334 Nevada Loop Rd
- 354 Nevada Loop Rd
- 324 Nevada Loop Rd
- 364 Nevada Loop Rd
- 335 Nevada Loop Rd
- 355 Nevada Loop Rd
- 314 Nevada Loop Rd
- 325 Nevada Loop Rd
- 374 Nevada Loop Rd
- 407 Nevada Loop Rd
- 315 Nevada Loop Rd
- 304 Nevada Loop Rd
- 123 Wexham Ct
- 244 Montana Ave
- 254 Montana Ave
- 133 Wexham Ct
- 417 Nevada Loop Rd
- 416 Nevada Loop Rd
- 223 Nevada Loop Rd
- 252 Nevada Loop Rd
Your Personal Tour Guide
Ask me questions while you tour the home.