Estimated Value: $424,000 - $496,000
5
Beds
2
Baths
1,990
Sq Ft
$229/Sq Ft
Est. Value
About This Home
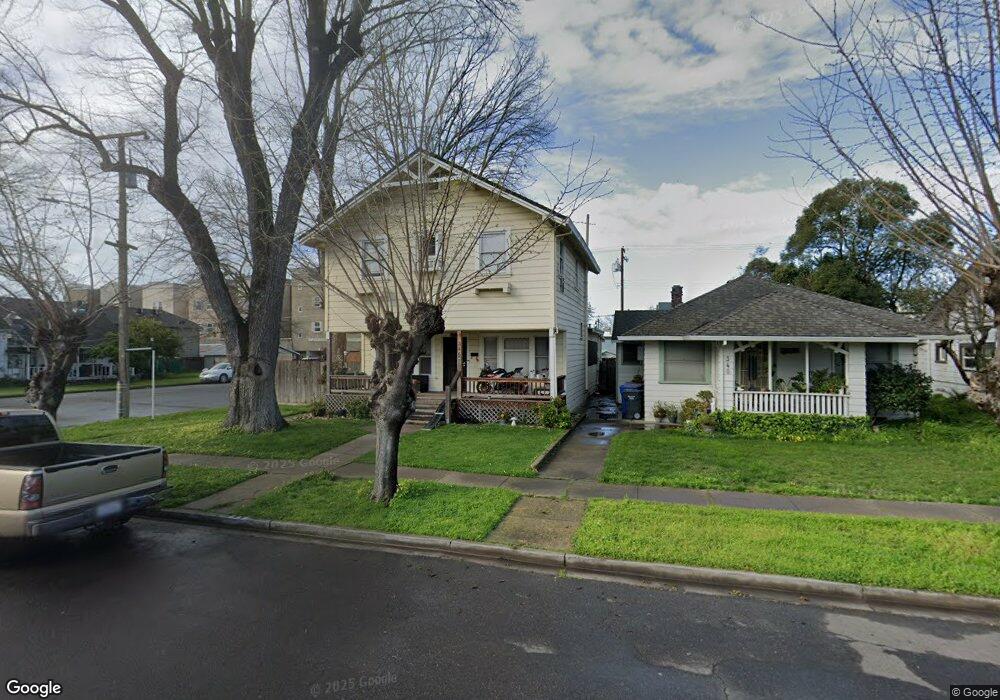
This home is located at 346 5th St, Galt, CA 95632 and is currently estimated at $455,136, approximately $228 per square foot. 346 5th St is a home located in Sacramento County with nearby schools including Valley Oaks Elementary School, Robert L. McCaffrey Middle School, and Galt High School.
Ownership History
Date
Name
Owned For
Owner Type
Purchase Details
Closed on
Aug 18, 2020
Sold by
Singhleton Garland Jean and Gloria Jean Beagle Trust
Bought by
Cortez Christopher Marin and Lopez Cynthia Maria
Current Estimated Value
Home Financials for this Owner
Home Financials are based on the most recent Mortgage that was taken out on this home.
Original Mortgage
$264,127
Outstanding Balance
$233,862
Interest Rate
2.9%
Mortgage Type
FHA
Estimated Equity
$221,274
Purchase Details
Closed on
Apr 18, 2007
Sold by
Beagle Jean
Bought by
Beagle Gloria Jean and Gloria Jean Beagle Trust
Create a Home Valuation Report for This Property
The Home Valuation Report is an in-depth analysis detailing your home's value as well as a comparison with similar homes in the area
Home Values in the Area
Average Home Value in this Area
Purchase History
| Date | Buyer | Sale Price | Title Company |
|---|---|---|---|
| Cortez Christopher Marin | $269,000 | Chicago Title Company | |
| Beagle Gloria Jean | -- | None Available |
Source: Public Records
Mortgage History
| Date | Status | Borrower | Loan Amount |
|---|---|---|---|
| Open | Cortez Christopher Marin | $264,127 |
Source: Public Records
Tax History
| Year | Tax Paid | Tax Assessment Tax Assessment Total Assessment is a certain percentage of the fair market value that is determined by local assessors to be the total taxable value of land and additions on the property. | Land | Improvement |
|---|---|---|---|---|
| 2025 | $3,204 | $291,169 | $103,505 | $187,664 |
| 2024 | $3,204 | $285,461 | $101,476 | $183,985 |
| 2023 | $3,150 | $279,865 | $99,487 | $180,378 |
| 2022 | $3,023 | $274,379 | $97,537 | $176,842 |
| 2021 | $3,431 | $269,000 | $95,625 | $173,375 |
| 2020 | $3,737 | $331,500 | $102,000 | $229,500 |
| 2019 | $429 | $38,263 | $9,557 | $28,706 |
| 2018 | $428 | $37,519 | $9,371 | $28,148 |
| 2017 | $412 | $36,785 | $9,188 | $27,597 |
| 2016 | $396 | $36,064 | $9,008 | $27,056 |
| 2015 | $382 | $35,523 | $8,873 | $26,650 |
| 2014 | $381 | $34,828 | $8,700 | $26,128 |
Source: Public Records
Map
Nearby Homes
- 433 5th St
- 461 F St
- 133 5th St
- 240 3rd St
- 0 B St Unit 226013319
- 712 Church St
- 150 Spruce Ave
- 700 2nd St Unit 40
- 700 2nd St Unit 14
- 219 Lois Ave
- 881 Spur Way
- 246 Oak Ave
- 667 Germaine Dr
- 105 Kent St
- 718 Crow Creek Cir
- 104 Wildflower Dr
- 691 Lippi St
- 702 Elm Ave
- 1095 Honeysuckle Hill Ave
- 1087 Honeysuckle Hill Ave
Your Personal Tour Guide
Ask me questions while you tour the home.