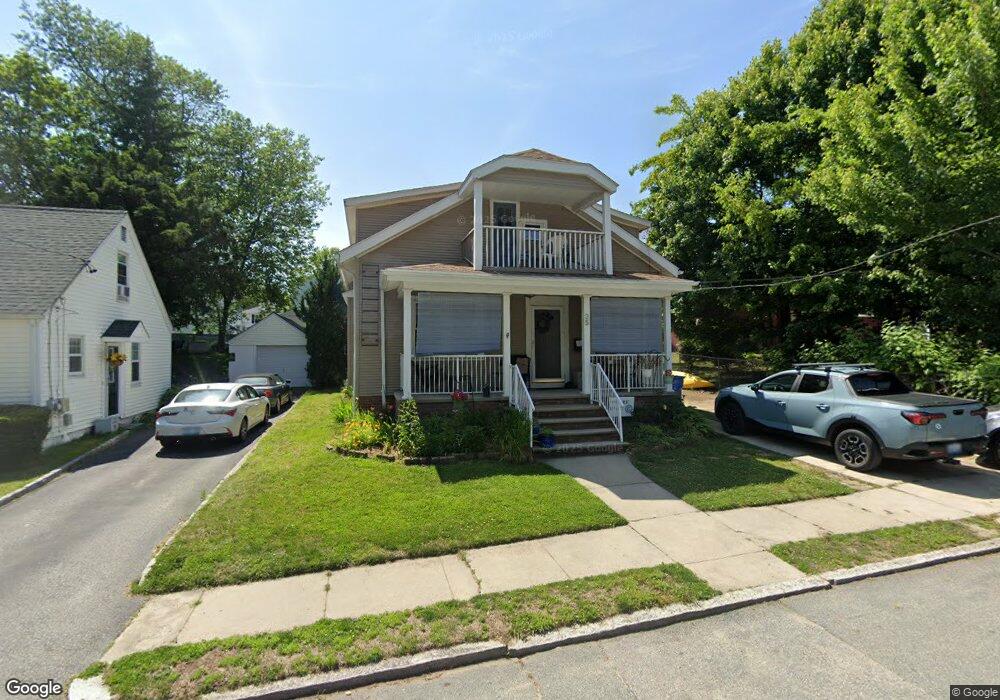
35 Milton Ave Cranston, RI 02905
Edgewood NeighborhoodEstimated Value: $459,919 - $582,000
4
Beds
2
Baths
1,647
Sq Ft
$329/Sq Ft
Est. Value
About This Home
This home is located at 35 Milton Ave, Cranston, RI 02905 and is currently estimated at $542,230, approximately $329 per square foot. 35 Milton Ave is a home located in Providence County with nearby schools including Edward S. Rhodes School, Park View Middle School, and Cranston High School East.
Ownership History
Date
Name
Owned For
Owner Type
Purchase Details
Closed on
Jun 19, 2008
Sold by
Cotton Jessica and Cotton William
Bought by
Federal National Mortgage Association
Current Estimated Value
Purchase Details
Closed on
Jun 7, 2005
Sold by
Henderson Ronald S and Henderson Diane M
Bought by
Moore Jennifer and Cotton William
Create a Home Valuation Report for This Property
The Home Valuation Report is an in-depth analysis detailing your home's value as well as a comparison with similar homes in the area
Home Values in the Area
Average Home Value in this Area
Purchase History
| Date | Buyer | Sale Price | Title Company |
|---|---|---|---|
| Federal National Mortgage Association | $248,000 | -- | |
| Moore Jennifer | $295,000 | -- |
Source: Public Records
Mortgage History
| Date | Status | Borrower | Loan Amount |
|---|---|---|---|
| Open | Moore Jennifer | $15,000 | |
| Open | Moore Jennifer | $200,000 | |
| Closed | Moore Jennifer | $225,431 |
Source: Public Records
Tax History
| Year | Tax Paid | Tax Assessment Tax Assessment Total Assessment is a certain percentage of the fair market value that is determined by local assessors to be the total taxable value of land and additions on the property. | Land | Improvement |
|---|---|---|---|---|
| 2025 | $4,957 | $357,100 | $106,900 | $250,200 |
| 2024 | $4,860 | $357,100 | $106,900 | $250,200 |
| 2023 | $4,581 | $242,400 | $70,400 | $172,000 |
| 2022 | $4,487 | $242,400 | $70,400 | $172,000 |
| 2021 | $4,363 | $242,400 | $70,400 | $172,000 |
| 2020 | $4,239 | $204,100 | $67,000 | $137,100 |
| 2019 | $4,239 | $204,100 | $67,000 | $137,100 |
| 2018 | $4,141 | $204,100 | $67,000 | $137,100 |
| 2017 | $4,021 | $175,300 | $60,300 | $115,000 |
| 2016 | $3,935 | $175,300 | $60,300 | $115,000 |
| 2015 | $3,935 | $175,300 | $60,300 | $115,000 |
| 2014 | $3,782 | $165,600 | $60,300 | $105,300 |
Source: Public Records
Map
Nearby Homes
- 73 Moorland Ave
- 68 Ferncrest Ave
- 10 Sylvan Ave
- 172 Bluff Ave
- 29 Malvern Ave
- 27 Cliffdale Ave
- 126 Columbia Ave
- 19 Warwick Ave
- 78 Villa Ave
- 42 Netherlands Ave
- 63 Taft St
- 73 Western Promenade
- 147 Wentworth Ave
- 27 Vickery St
- 1180 Narragansett Blvd Unit 1
- 115 Irving Rd
- 94 Holmes Rd
- 210 Irving Rd
- 166 Narragansett St
- 200 Post Rd Unit 419
Your Personal Tour Guide
Ask me questions while you tour the home.