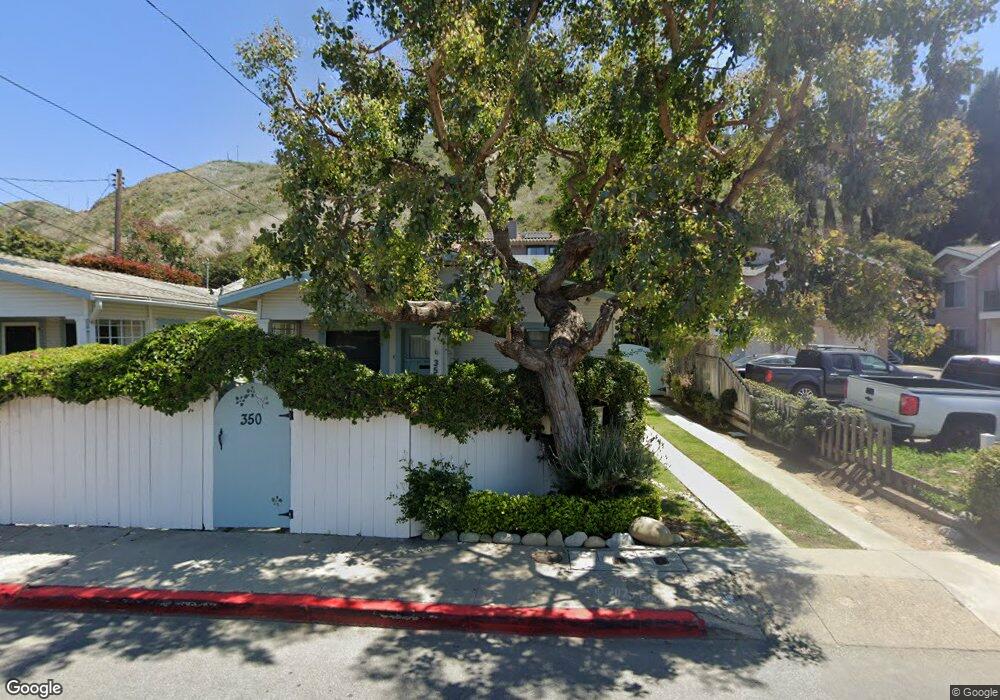
350 Wall St Ventura, CA 93001
Westside NeighborhoodEstimated Value: $607,288 - $762,000
2
Beds
1
Bath
660
Sq Ft
$1,044/Sq Ft
Est. Value
About This Home
This home is located at 350 Wall St, Ventura, CA 93001 and is currently estimated at $688,822, approximately $1,043 per square foot. 350 Wall St is a home located in Ventura County with nearby schools including Will Rogers Elementary School, De Anza Academy Of Technology And The Arts, and Ventura High School.
Ownership History
Date
Name
Owned For
Owner Type
Purchase Details
Closed on
Dec 2, 1999
Sold by
Diane Vanarsdall
Bought by
Frost Francis E and Frost Elisabeth F
Current Estimated Value
Home Financials for this Owner
Home Financials are based on the most recent Mortgage that was taken out on this home.
Original Mortgage
$101,600
Outstanding Balance
$32,046
Interest Rate
7.96%
Estimated Equity
$656,776
Purchase Details
Closed on
Jan 6, 1998
Sold by
Vanarsdall Diane and Vanarsdall Norman
Bought by
Vanarsdall Diane
Purchase Details
Closed on
Apr 10, 1996
Sold by
Duckworth Robert
Bought by
Vanarsdall Diane
Purchase Details
Closed on
Feb 2, 1996
Sold by
Olivera Dolores M
Bought by
Vanarsdall Diane and Vanarsdall Norman
Home Financials for this Owner
Home Financials are based on the most recent Mortgage that was taken out on this home.
Original Mortgage
$72,000
Interest Rate
7.84%
Purchase Details
Closed on
Sep 21, 1993
Sold by
Olivera Dolores M
Bought by
Olivera Dolores M
Create a Home Valuation Report for This Property
The Home Valuation Report is an in-depth analysis detailing your home's value as well as a comparison with similar homes in the area
Home Values in the Area
Average Home Value in this Area
Purchase History
| Date | Buyer | Sale Price | Title Company |
|---|---|---|---|
| Frost Francis E | $127,000 | Fidelity National Title Co | |
| Vanarsdall Diane | -- | -- | |
| Vanarsdall Diane | -- | Chicago Title Co | |
| Vanarsdall Diane | $80,000 | Chicago Title Co | |
| Olivera Dolores M | -- | -- |
Source: Public Records
Mortgage History
| Date | Status | Borrower | Loan Amount |
|---|---|---|---|
| Open | Frost Francis E | $101,600 | |
| Previous Owner | Vanarsdall Diane | $72,000 |
Source: Public Records
Tax History
| Year | Tax Paid | Tax Assessment Tax Assessment Total Assessment is a certain percentage of the fair market value that is determined by local assessors to be the total taxable value of land and additions on the property. | Land | Improvement |
|---|---|---|---|---|
| 2025 | $2,181 | $195,161 | $138,313 | $56,848 |
| 2024 | $2,181 | $191,335 | $135,601 | $55,734 |
| 2023 | $2,156 | $187,584 | $132,942 | $54,642 |
| 2022 | $2,012 | $183,906 | $130,335 | $53,571 |
| 2021 | $1,974 | $180,300 | $127,779 | $52,521 |
| 2020 | $1,956 | $178,454 | $126,470 | $51,984 |
| 2019 | $1,921 | $174,956 | $123,991 | $50,965 |
| 2018 | $1,890 | $171,526 | $121,560 | $49,966 |
| 2017 | $1,851 | $168,164 | $119,177 | $48,987 |
| 2016 | $1,816 | $164,868 | $116,841 | $48,027 |
| 2015 | $1,798 | $162,393 | $115,087 | $47,306 |
| 2014 | $1,769 | $159,214 | $112,834 | $46,380 |
Source: Public Records
Map
Nearby Homes
- 320 N Ventura Ave
- 323 Wall St
- 285 N Ventura Ave Unit 5
- 161 N Garden
- 130 N Garden St Unit 1103
- 161 N Garden St
- 531 Cedar St
- 61 W Center St
- 326 W Mission Ave
- 436 Poli St Unit 301
- 281 W Main St
- 184 Kellogg St
- 335 W Simpson St
- 852 N Ventura Ave
- 557 561 N North Olive St
- 148 Beach Side Ct
- 168 S Palm St
- 307 Oakwood St
- 812 Venwood Ave
- 201 S Olive St
Your Personal Tour Guide
Ask me questions while you tour the home.