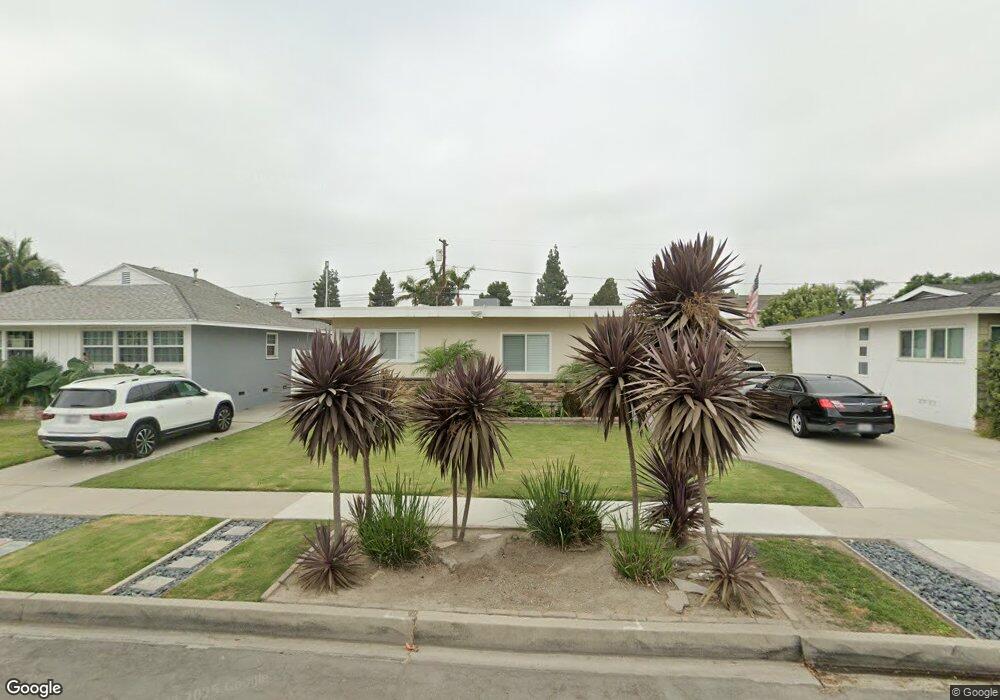
3517 Nipomo Ave Long Beach, CA 90808
Plaza NeighborhoodEstimated Value: $930,000 - $1,128,006
3
Beds
2
Baths
1,300
Sq Ft
$801/Sq Ft
Est. Value
About This Home
This home is located at 3517 Nipomo Ave, Long Beach, CA 90808 and is currently estimated at $1,040,752, approximately $800 per square foot. 3517 Nipomo Ave is a home located in Los Angeles County with nearby schools including Cubberley K-8, Millikan High School, and St. Maria Goretti Catholic School.
Ownership History
Date
Name
Owned For
Owner Type
Purchase Details
Closed on
Aug 10, 2016
Sold by
Gentry Ty S
Bought by
Gentry Ty S and Gentry Christy C
Current Estimated Value
Home Financials for this Owner
Home Financials are based on the most recent Mortgage that was taken out on this home.
Original Mortgage
$408,000
Outstanding Balance
$257,132
Interest Rate
3.48%
Mortgage Type
New Conventional
Estimated Equity
$783,620
Purchase Details
Closed on
Dec 14, 2006
Sold by
Summer Aysha
Bought by
Gentry Ty Scott
Home Financials for this Owner
Home Financials are based on the most recent Mortgage that was taken out on this home.
Original Mortgage
$436,000
Interest Rate
7.03%
Mortgage Type
Negative Amortization
Purchase Details
Closed on
May 16, 2005
Sold by
Fell Lawrence M and Fell Terry
Bought by
Summer Aysha
Home Financials for this Owner
Home Financials are based on the most recent Mortgage that was taken out on this home.
Original Mortgage
$380,000
Interest Rate
6.5%
Mortgage Type
Fannie Mae Freddie Mac
Create a Home Valuation Report for This Property
The Home Valuation Report is an in-depth analysis detailing your home's value as well as a comparison with similar homes in the area
Home Values in the Area
Average Home Value in this Area
Purchase History
| Date | Buyer | Sale Price | Title Company |
|---|---|---|---|
| Gentry Ty S | -- | Pacific Coast Title Company | |
| Gentry Ty Scott | $545,000 | First American Title Co | |
| Summer Aysha | $475,000 | Orange Coast Title Company |
Source: Public Records
Mortgage History
| Date | Status | Borrower | Loan Amount |
|---|---|---|---|
| Open | Gentry Ty S | $408,000 | |
| Closed | Gentry Ty Scott | $436,000 | |
| Previous Owner | Summer Aysha | $380,000 | |
| Closed | Summer Aysha | $95,000 |
Source: Public Records
Tax History
| Year | Tax Paid | Tax Assessment Tax Assessment Total Assessment is a certain percentage of the fair market value that is determined by local assessors to be the total taxable value of land and additions on the property. | Land | Improvement |
|---|---|---|---|---|
| 2025 | $10,523 | $828,107 | $569,535 | $258,572 |
| 2024 | $10,523 | $811,870 | $558,368 | $253,502 |
| 2023 | $10,349 | $795,952 | $547,420 | $248,532 |
| 2022 | $9,710 | $780,346 | $536,687 | $243,659 |
| 2021 | $8,988 | $720,000 | $493,400 | $226,600 |
| 2019 | $8,633 | $680,000 | $466,000 | $214,000 |
| 2018 | $7,746 | $617,000 | $423,000 | $194,000 |
| 2016 | $7,009 | $583,000 | $400,000 | $183,000 |
| 2015 | $6,408 | $546,000 | $375,000 | $171,000 |
| 2014 | $6,482 | $546,000 | $375,000 | $171,000 |
Source: Public Records
Map
Nearby Homes
- 3502 Monogram Ave
- 6829 E Parapet St
- 3326 Hackett Ave
- 3635 Conquista Ave
- 3728 Conquista Ave
- 3903 N Studebaker Rd
- 3764 Conquista Ave
- 3717 Canehill Ave
- 3062 Lees Ave
- 3814 Stevely Ave
- 3816 Snowden Ave
- 3738 Gondar Ave
- 3012 Knoxville Ave
- 3166 Senasac Ave
- 7020 Schroll St
- 7050 Schroll St
- 4151 Los Coyotes Diagonal
- 4218 Ostrom Ave
- 4256 Quigley Ave
- 6107 Carson St
- 3523 Nipomo Ave
- 3509 Nipomo Ave
- 3514 Monogram Ave
- 3520 Monogram Ave
- 3529 Nipomo Ave
- 3508 Monogram Ave
- 3503 Nipomo Ave
- 3524 Monogram Ave
- 6728 E Huntdale St
- 3514 Nipomo Ave
- 3533 Nipomo Ave
- 3508 Nipomo Ave
- 3463 Nipomo Ave
- 3530 Monogram Ave
- 3462 Monogram Ave
- 3502 Nipomo Ave
- 3539 Nipomo Ave
- 3457 Nipomo Ave
- 3536 Monogram Ave
- 3456 Monogram Ave
Your Personal Tour Guide
Ask me questions while you tour the home.