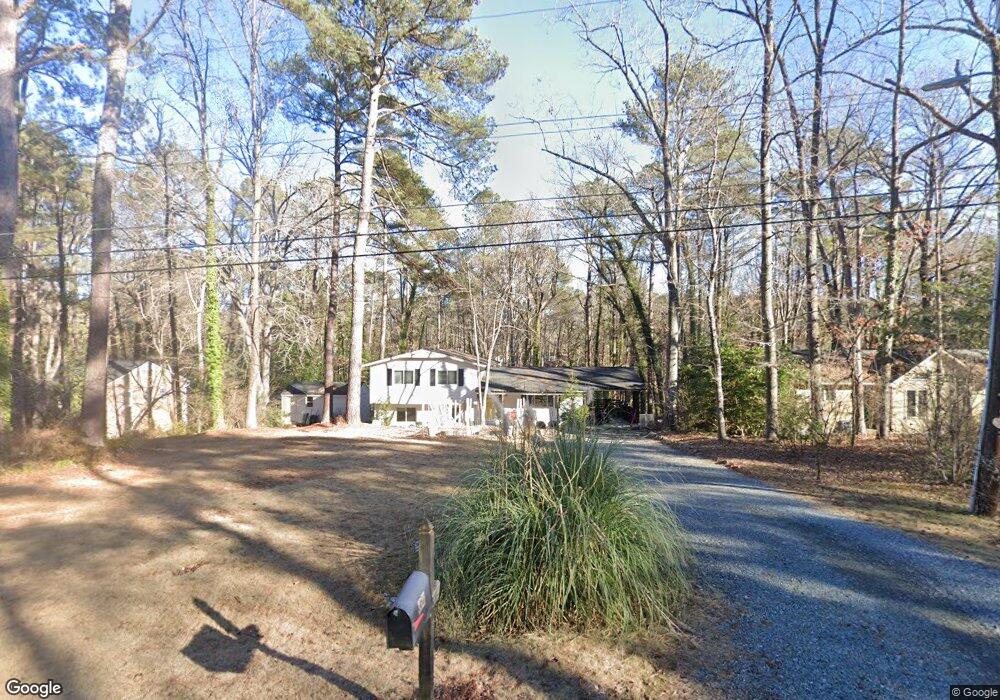
3521 Hamstead Ct Durham, NC 27707
Hope Valley NeighborhoodEstimated Value: $510,000 - $584,000
4
Beds
3
Baths
2,145
Sq Ft
$254/Sq Ft
Est. Value
About This Home
This home is located at 3521 Hamstead Ct, Durham, NC 27707 and is currently estimated at $544,275, approximately $253 per square foot. 3521 Hamstead Ct is a home located in Durham County with nearby schools including Morehead Montessori, Sherwood Githens Middle, and Jordan High School.
Ownership History
Date
Name
Owned For
Owner Type
Purchase Details
Closed on
Feb 21, 2020
Sold by
Kenburn Restoration Llc
Bought by
Martinson Christina Rentz and Martinson Jared Lee
Current Estimated Value
Home Financials for this Owner
Home Financials are based on the most recent Mortgage that was taken out on this home.
Original Mortgage
$315,000
Outstanding Balance
$278,910
Interest Rate
3.6%
Mortgage Type
New Conventional
Estimated Equity
$265,365
Purchase Details
Closed on
Aug 20, 2019
Sold by
Emerson Randall W
Bought by
Kenburn Restoration Llc
Home Financials for this Owner
Home Financials are based on the most recent Mortgage that was taken out on this home.
Original Mortgage
$225,000
Interest Rate
3.7%
Mortgage Type
Purchase Money Mortgage
Purchase Details
Closed on
Jun 21, 1999
Sold by
Emerson Randall W and Emerson Drew A
Bought by
Emerson Randall W
Home Financials for this Owner
Home Financials are based on the most recent Mortgage that was taken out on this home.
Original Mortgage
$99,750
Interest Rate
6.37%
Create a Home Valuation Report for This Property
The Home Valuation Report is an in-depth analysis detailing your home's value as well as a comparison with similar homes in the area
Home Values in the Area
Average Home Value in this Area
Purchase History
| Date | Buyer | Sale Price | Title Company |
|---|---|---|---|
| Martinson Christina Rentz | $350,000 | None Available | |
| Kenburn Restoration Llc | $190,000 | None Available | |
| Emerson Randall W | -- | -- |
Source: Public Records
Mortgage History
| Date | Status | Borrower | Loan Amount |
|---|---|---|---|
| Open | Martinson Christina Rentz | $315,000 | |
| Previous Owner | Kenburn Restoration Llc | $225,000 | |
| Previous Owner | Emerson Randall W | $99,750 | |
| Closed | Emerson Randall W | $19,950 |
Source: Public Records
Tax History
| Year | Tax Paid | Tax Assessment Tax Assessment Total Assessment is a certain percentage of the fair market value that is determined by local assessors to be the total taxable value of land and additions on the property. | Land | Improvement |
|---|---|---|---|---|
| 2025 | $4,885 | $492,835 | $217,000 | $275,835 |
| 2024 | $4,182 | $299,792 | $77,400 | $222,392 |
| 2023 | $3,927 | $299,792 | $77,400 | $222,392 |
| 2022 | $3,837 | $299,792 | $77,400 | $222,392 |
| 2021 | $3,819 | $256,343 | $77,400 | $178,943 |
| 2020 | $3,008 | $241,806 | $77,400 | $164,406 |
| 2019 | $3,008 | $241,806 | $77,400 | $164,406 |
| 2018 | $2,589 | $190,851 | $46,440 | $144,411 |
| 2017 | $2,570 | $190,851 | $46,440 | $144,411 |
| 2016 | $2,483 | $190,851 | $46,440 | $144,411 |
| 2015 | $2,622 | $189,411 | $40,834 | $148,577 |
| 2014 | $2,622 | $189,411 | $40,834 | $148,577 |
Source: Public Records
Map
Nearby Homes
- 704 Brighton Rd
- 3457 Hope Valley Rd
- 305 Reynolds Ave N
- 170 Cedar Elm Rd
- 160 Grey Elm Trail
- 188 Grey Elm Trail
- 344 Red Elm Dr
- 221 Grey Elm Trail
- 123 Grey Elm Trail
- 304 Red Elm Dr
- 102 Grey Elm Trail
- 3713 Ramblewood Ave
- 3811 Ramblewood Ave
- 3622 Colchester St Unit 1
- 1311 Martin Luther King Junior Pkwy
- 3724 Hope Valley Rd
- 21 Winchester Ct
- 1105 Searstone Ct
- 2235 Alpine Rd
- 3624 Shrewsbury St
- 3523 Hamstead Ct
- 3519 Hamstead Ct
- 3525 Hamstead Ct
- 3509 Hamstead Ct
- 3516 Manford Dr
- 3512 Manford Dr
- 3520 Manford Dr
- 3516 Hamstead Ct
- 3510 Manford Dr
- 3527 Hamstead Ct
- 3526 Hamstead Ct
- 3524 Manford Dr
- 3508 Hamstead Ct
- 3508 Manford Dr
- 611 Brighton Rd
- 3528 Manford Dr
- 3506 Hamstead Ct
- 3501 Hamstead Ct
- 3528 Hamstead Ct
- 3531 Hamstead Ct
Your Personal Tour Guide
Ask me questions while you tour the home.