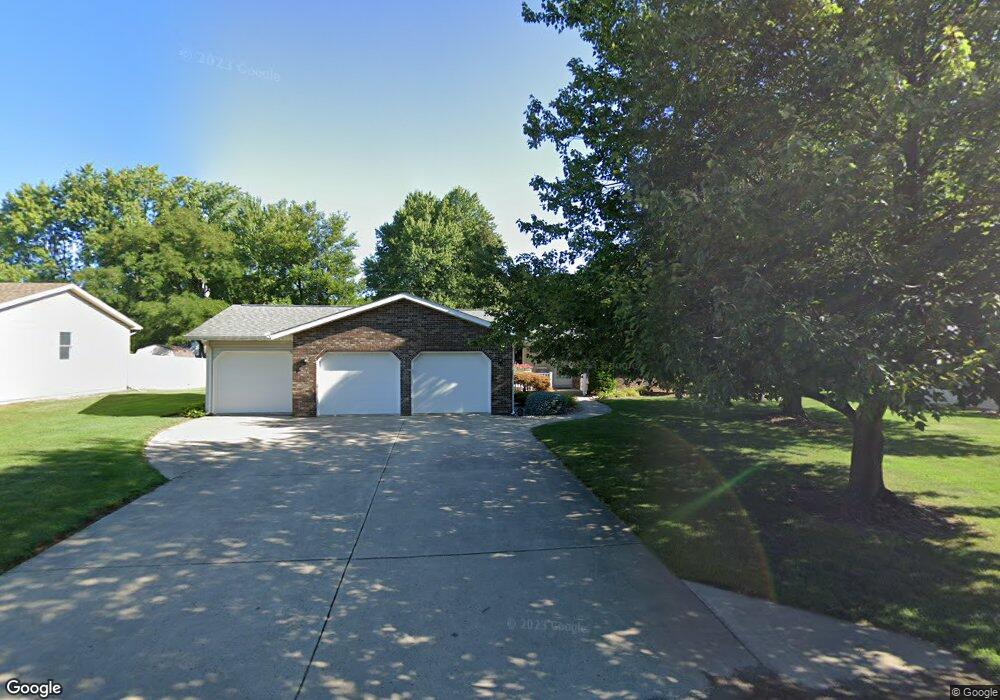
353 Lutterbein St Edgerton, OH 43517
Estimated Value: $177,000 - $202,159
3
Beds
2
Baths
1,592
Sq Ft
$118/Sq Ft
Est. Value
About This Home
This home is located at 353 Lutterbein St, Edgerton, OH 43517 and is currently estimated at $187,290, approximately $117 per square foot. 353 Lutterbein St is a home located in Williams County with nearby schools including Edgerton Elementary School, Edgerton High School, and St. Mary School.
Ownership History
Date
Name
Owned For
Owner Type
Purchase Details
Closed on
Dec 15, 2004
Sold by
Jewell Esther
Bought by
Farnham Denise L
Current Estimated Value
Purchase Details
Closed on
Mar 19, 2004
Sold by
Jewell Teddy L and Jewell Esther I
Bought by
Jewell Esther
Purchase Details
Closed on
Jan 1, 1990
Bought by
Jewell Teddy L and Jewell Esther I
Create a Home Valuation Report for This Property
The Home Valuation Report is an in-depth analysis detailing your home's value as well as a comparison with similar homes in the area
Home Values in the Area
Average Home Value in this Area
Purchase History
| Date | Buyer | Sale Price | Title Company |
|---|---|---|---|
| Farnham Denise L | $137,000 | -- | |
| Jewell Esther | -- | -- | |
| Jewell Teddy L | -- | -- |
Source: Public Records
Tax History Compared to Growth
Tax History
| Year | Tax Paid | Tax Assessment Tax Assessment Total Assessment is a certain percentage of the fair market value that is determined by local assessors to be the total taxable value of land and additions on the property. | Land | Improvement |
|---|---|---|---|---|
| 2024 | $1,972 | $60,130 | $5,460 | $54,670 |
| 2023 | $1,944 | $49,320 | $5,640 | $43,680 |
| 2022 | $1,748 | $49,320 | $5,640 | $43,680 |
| 2021 | $1,748 | $49,320 | $5,640 | $43,680 |
| 2020 | $1,842 | $41,090 | $4,690 | $36,400 |
| 2019 | $1,821 | $41,090 | $4,690 | $36,400 |
| 2018 | $1,679 | $41,090 | $4,690 | $36,400 |
| 2017 | $1,618 | $36,370 | $4,690 | $31,680 |
| 2016 | $1,533 | $36,370 | $4,690 | $31,680 |
| 2015 | $1,622 | $36,370 | $4,690 | $31,680 |
| 2014 | $1,622 | $36,370 | $4,690 | $31,680 |
| 2013 | $1,592 | $36,370 | $4,690 | $31,680 |
Source: Public Records
Map
Nearby Homes
- 318 N Daniel St
- 104 Knox Ln
- 00 County Road 4-50
- 4831 County Road 4-50
- 1974 State Route 49
- 6163 County Road 4-50
- 8873 County Road C
- 8825 County Road D
- 3631 Lake St
- 0 G Rd Unit 10000002
- 0 County Road G
- 7825 County Road 7g
- 10258 County Road D
- 322 Dublin Ln
- 324 Dublin Ln
- 101 Westview St
- 0 Saint Andrews Dr
- 202 Belfast Ln
- 00 Troon Ct
- 202 N Ivy Ln
- 361 Lutterbein St
- 343 Lutterbein St
- 354 E River St
- 344 E River St
- 367 Lutterbein St
- 358 E River St
- 356 Lutterbein St
- 362 Lutterbein St
- 334 E River St
- 368 Lutterbein St
- 344 Lutterbein St
- 324 E River St
- 331 Lutterbein St
- 458 John W Ave
- 448 John St W
- 347 E Gerhart St
- 347 E Gearhart
- 448 John W Ave
- 353 E Gerhart St
- 337 E Gerhart St