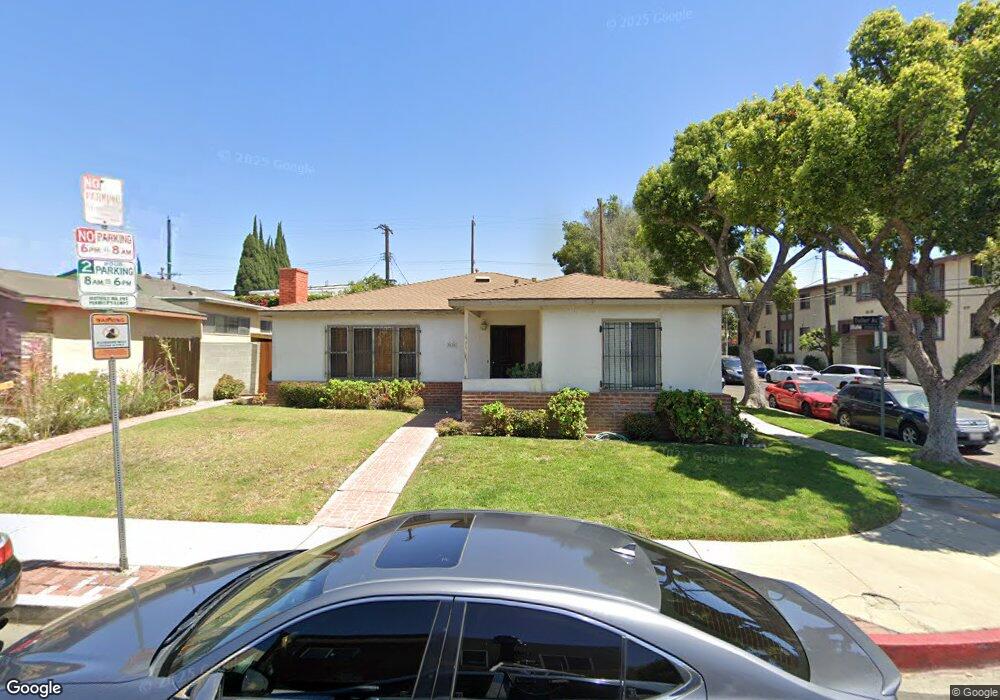
3538 Tuller Ave Los Angeles, CA 90034
Palms NeighborhoodEstimated Value: $1,740,000 - $1,836,218
4
Beds
2
Baths
2,103
Sq Ft
$847/Sq Ft
Est. Value
About This Home
This home is located at 3538 Tuller Ave, Los Angeles, CA 90034 and is currently estimated at $1,780,305, approximately $846 per square foot. 3538 Tuller Ave is a home located in Los Angeles County with nearby schools including Charnock Road Elementary School, Daniel Webster Middle School, and Venice High School.
Ownership History
Date
Name
Owned For
Owner Type
Purchase Details
Closed on
Oct 26, 2016
Sold by
Hellems Maria Cristina Toranzo
Bought by
Hellems Thomas M and Hellems Cristina
Current Estimated Value
Purchase Details
Closed on
Jul 12, 2014
Sold by
Hellems Thomas M and Toranzo Maria Cristina
Bought by
Hellems Maria Cristina Toranzo
Home Financials for this Owner
Home Financials are based on the most recent Mortgage that was taken out on this home.
Original Mortgage
$183,700
Interest Rate
4.16%
Mortgage Type
New Conventional
Purchase Details
Closed on
May 19, 2012
Sold by
Toranzo Victor M and Toranzo Cristina
Bought by
Toranzo Cristina
Purchase Details
Closed on
Feb 20, 1995
Sold by
Toranzo Victor M
Bought by
Toranzo Victor M and Toranzo Cristina
Create a Home Valuation Report for This Property
The Home Valuation Report is an in-depth analysis detailing your home's value as well as a comparison with similar homes in the area
Home Values in the Area
Average Home Value in this Area
Purchase History
| Date | Buyer | Sale Price | Title Company |
|---|---|---|---|
| Hellems Thomas M | -- | None Available | |
| Hellems Maria Cristina Toranzo | -- | First American Title Ins Co | |
| Hellems Maria Cristina Toranzo | -- | First American Title Ins Co | |
| Toranzo Cristina | -- | None Available | |
| Toranzo Victor M | -- | -- |
Source: Public Records
Mortgage History
| Date | Status | Borrower | Loan Amount |
|---|---|---|---|
| Closed | Hellems Maria Cristina Toranzo | $183,700 |
Source: Public Records
Tax History Compared to Growth
Tax History
| Year | Tax Paid | Tax Assessment Tax Assessment Total Assessment is a certain percentage of the fair market value that is determined by local assessors to be the total taxable value of land and additions on the property. | Land | Improvement |
|---|---|---|---|---|
| 2025 | $2,080 | $147,535 | $58,805 | $88,730 |
| 2024 | $2,080 | $144,643 | $57,652 | $86,991 |
| 2023 | $2,049 | $141,808 | $56,522 | $85,286 |
| 2022 | $1,967 | $139,028 | $55,414 | $83,614 |
| 2021 | $1,930 | $136,303 | $54,328 | $81,975 |
| 2020 | $1,994 | $134,906 | $53,771 | $81,135 |
| 2019 | $1,878 | $132,262 | $52,717 | $79,545 |
| 2018 | $1,812 | $129,670 | $51,684 | $77,986 |
| 2016 | $1,715 | $124,636 | $49,678 | $74,958 |
| 2015 | $1,693 | $122,765 | $48,932 | $73,833 |
| 2014 | $1,710 | $120,361 | $47,974 | $72,387 |
Source: Public Records
Map
Nearby Homes
- 3523 S Sepulveda Blvd
- 3500 Tuller Ave
- 11286 Westminster Ave Unit 101
- 0 Sawtelle Blvd
- 3507 Military Ave
- 3401 S Bentley Ave Unit 306
- 10980 Palms Blvd Unit 1
- 10980 Palms Blvd Unit 5
- 3667 Sawtelle Blvd
- 11419 Charnock Rd
- 3491 Butler Ave
- 11523 Vienna Way
- 3315 S Bentley Ave
- 3765 Globe Ave
- 3569 Kelton Ave
- 11120 Queensland St Unit H57
- 3300 S Sepulveda Blvd Unit L27
- 11061 Venice Blvd
- 11622 Charnock Rd
- 3716 Greenfield Ave
- 11185 Westminster Ave Unit C
- 11185 Westminster Ave Unit B
- 3532 Tuller Ave
- 3535 S Sepulveda Blvd
- 3526 Tuller Ave
- 3539 Tuller Ave
- 11176 Westminster Ave Unit G
- 11176 Westminster Ave Unit D
- 3533 Tuller Ave
- 11180 Westminster Ave Unit E
- 11180 Westminster Ave Unit F
- 3522 Tuller Ave
- 3527 Tuller Ave
- 3517 S Sepulveda Blvd
- 3523 Tuller Ave
- 3516 Tuller Ave
- 3517 Tuller Ave
- 3510 Tuller Ave
- 3511 Tuller Ave
- 3565 S Sepulveda Blvd