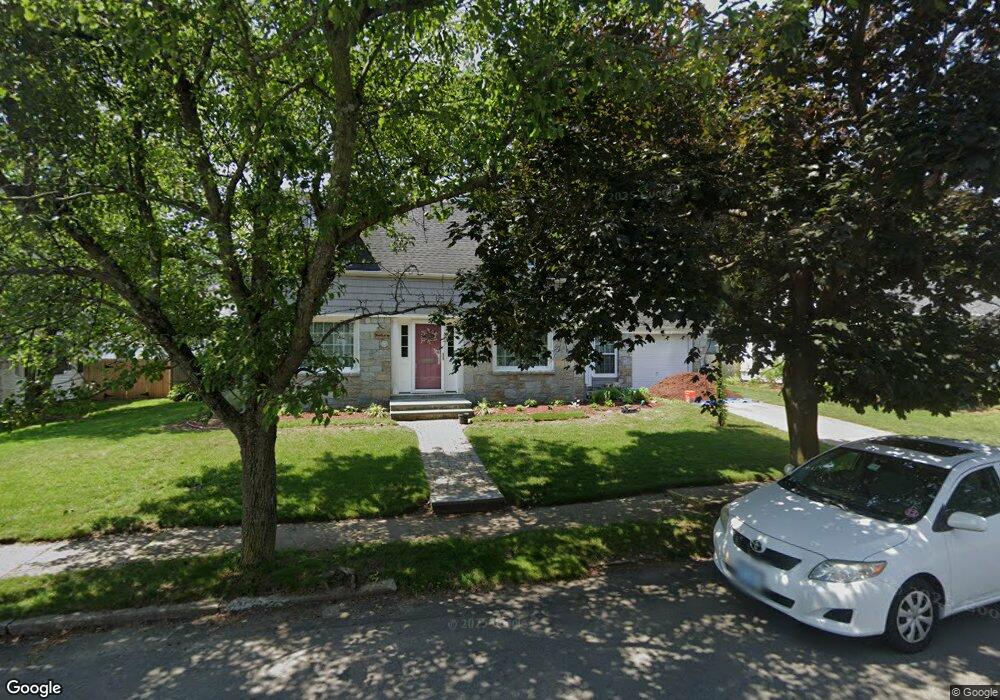
36 Bryant Rd Cranston, RI 02910
Eden Park NeighborhoodEstimated Value: $431,140 - $501,000
2
Beds
2
Baths
1,464
Sq Ft
$311/Sq Ft
Est. Value
About This Home
This home is located at 36 Bryant Rd, Cranston, RI 02910 and is currently estimated at $455,535, approximately $311 per square foot. 36 Bryant Rd is a home located in Providence County with nearby schools including Park View Middle School, Cranston High School East, and Cadence Academy Preschool - Cranston.
Ownership History
Date
Name
Owned For
Owner Type
Purchase Details
Closed on
Dec 20, 1989
Sold by
Bellini Angelo F
Bought by
Coutu Claire G
Current Estimated Value
Home Financials for this Owner
Home Financials are based on the most recent Mortgage that was taken out on this home.
Original Mortgage
$106,000
Interest Rate
9.69%
Create a Home Valuation Report for This Property
The Home Valuation Report is an in-depth analysis detailing your home's value as well as a comparison with similar homes in the area
Home Values in the Area
Average Home Value in this Area
Purchase History
| Date | Buyer | Sale Price | Title Company |
|---|---|---|---|
| Coutu Claire G | $135,000 | -- |
Source: Public Records
Mortgage History
| Date | Status | Borrower | Loan Amount |
|---|---|---|---|
| Closed | Coutu Claire G | $105,000 | |
| Closed | Coutu Claire G | $106,000 |
Source: Public Records
Tax History
| Year | Tax Paid | Tax Assessment Tax Assessment Total Assessment is a certain percentage of the fair market value that is determined by local assessors to be the total taxable value of land and additions on the property. | Land | Improvement |
|---|---|---|---|---|
| 2025 | $5,149 | $371,000 | $108,800 | $262,200 |
| 2024 | $5,049 | $371,000 | $108,800 | $262,200 |
| 2023 | $5,570 | $294,700 | $71,700 | $223,000 |
| 2022 | $5,455 | $294,700 | $71,700 | $223,000 |
| 2021 | $5,305 | $294,700 | $71,700 | $223,000 |
| 2020 | $4,956 | $238,600 | $68,200 | $170,400 |
| 2019 | $4,956 | $238,600 | $68,200 | $170,400 |
| 2018 | $4,841 | $238,600 | $68,200 | $170,400 |
| 2017 | $4,689 | $204,400 | $61,400 | $143,000 |
| 2016 | $4,589 | $204,400 | $61,400 | $143,000 |
| 2015 | $4,589 | $204,400 | $61,400 | $143,000 |
| 2014 | $4,333 | $189,700 | $61,400 | $128,300 |
Source: Public Records
Map
Nearby Homes
Your Personal Tour Guide
Ask me questions while you tour the home.