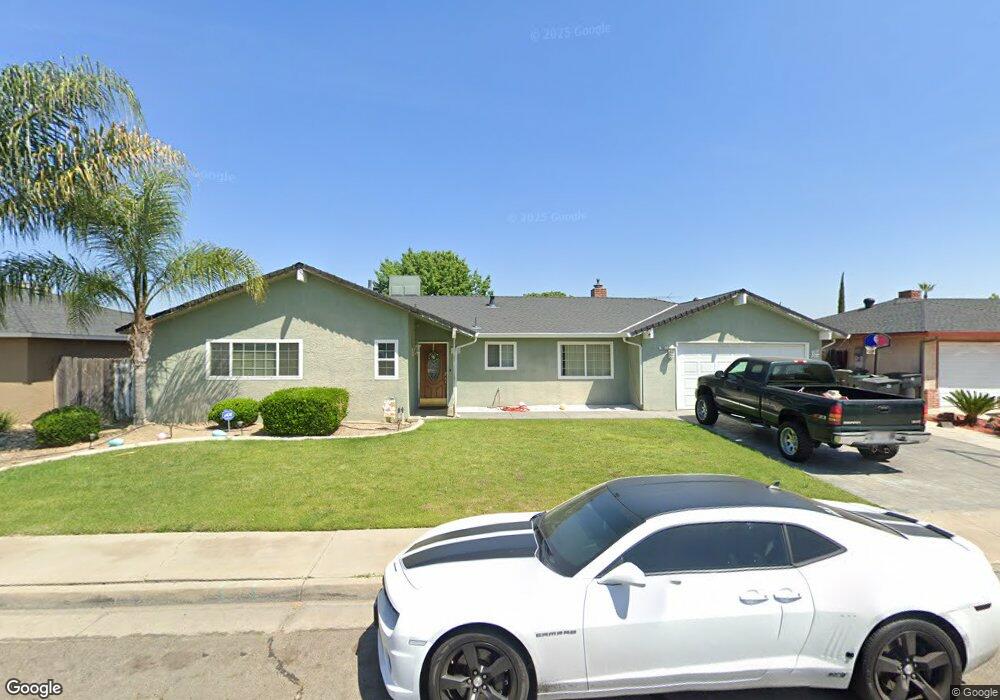
361 Pacemaker Dr Atwater, CA 95301
Estimated Value: $247,000 - $387,000
3
Beds
2
Baths
1,394
Sq Ft
$244/Sq Ft
Est. Value
About This Home
This home is located at 361 Pacemaker Dr, Atwater, CA 95301 and is currently estimated at $340,242, approximately $244 per square foot. 361 Pacemaker Dr is a home located in Merced County with nearby schools including Thomas Olaeta Elementary School, Mitchell Intermediate School, and Buhach Colony High School.
Ownership History
Date
Name
Owned For
Owner Type
Purchase Details
Closed on
Dec 20, 2001
Sold by
Quirarte Hernandez Juan M and Quirarte Hernandez Lorena
Bought by
Hernandez Juan M and Quirarte Lorena
Current Estimated Value
Home Financials for this Owner
Home Financials are based on the most recent Mortgage that was taken out on this home.
Original Mortgage
$80,554
Interest Rate
6.51%
Mortgage Type
Stand Alone First
Purchase Details
Closed on
Jan 6, 2000
Sold by
Va
Bought by
Quirarte Hernandez Juan M and Quirarte Hernandez Lorena
Home Financials for this Owner
Home Financials are based on the most recent Mortgage that was taken out on this home.
Original Mortgage
$81,474
Interest Rate
8.14%
Mortgage Type
FHA
Purchase Details
Closed on
Oct 19, 1999
Sold by
Aurora Loan Services Inc
Bought by
Va
Purchase Details
Closed on
Oct 14, 1999
Sold by
Kunkel Robert Wayne and Kunkel Annabell
Bought by
Aurora Loan Services Inc
Create a Home Valuation Report for This Property
The Home Valuation Report is an in-depth analysis detailing your home's value as well as a comparison with similar homes in the area
Home Values in the Area
Average Home Value in this Area
Purchase History
| Date | Buyer | Sale Price | Title Company |
|---|---|---|---|
| Hernandez Juan M | -- | Chicago Title Co | |
| Quirarte Hernandez Juan M | $82,000 | Transcounty Title Company | |
| Va | -- | American Title | |
| Aurora Loan Services Inc | $78,012 | Fidelity National Title Ins |
Source: Public Records
Mortgage History
| Date | Status | Borrower | Loan Amount |
|---|---|---|---|
| Closed | Hernandez Juan M | $80,554 | |
| Previous Owner | Quirarte Hernandez Juan M | $81,474 |
Source: Public Records
Tax History
| Year | Tax Paid | Tax Assessment Tax Assessment Total Assessment is a certain percentage of the fair market value that is determined by local assessors to be the total taxable value of land and additions on the property. | Land | Improvement |
|---|---|---|---|---|
| 2025 | $1,348 | $126,007 | $38,415 | $87,592 |
| 2024 | $1,348 | $123,537 | $37,662 | $85,875 |
| 2023 | $1,313 | $121,116 | $36,924 | $84,192 |
| 2022 | $1,298 | $118,742 | $36,200 | $82,542 |
| 2021 | $1,300 | $116,415 | $35,491 | $80,924 |
| 2020 | $1,285 | $115,223 | $35,128 | $80,095 |
| 2019 | $1,231 | $112,965 | $34,440 | $78,525 |
| 2018 | $1,200 | $110,751 | $33,765 | $76,986 |
| 2017 | $1,184 | $108,580 | $33,103 | $75,477 |
| 2016 | $1,166 | $106,452 | $32,454 | $73,998 |
| 2015 | $1,152 | $104,854 | $31,967 | $72,887 |
| 2014 | $1,125 | $102,801 | $31,341 | $71,460 |
Source: Public Records
Map
Nearby Homes
- 1675 Almador Terrace
- 0 Alabama St Unit MC25081689
- 0 Alabama St Unit MC25081688
- 0 Alabama St Unit MC25081690
- 517 E Grove Ave
- 2310 Linden St
- 1652 Chaparral Ct
- 288 E Fir Ave
- 1160 Oak Ave
- 1510 High St
- 1739 1st St
- 1739 First St
- 2900 Los Altos Ct
- 1053 Huntingdale Way
- 1263 Juniper Ave
- 401 Cedar Ave
- 2900 Muir Ave Unit 85
- 42 Rancho Grande Cir
- 42 Rancho Grande Cir Unit 42
- 1485 Mulberry Ave
Your Personal Tour Guide
Ask me questions while you tour the home.