
Seller's Agent in 2024
Hilary Sutter
My Home Group
(480) 201-2963
6 in this area
170 Total Sales
Estimated Value: $416,000 - $470,000
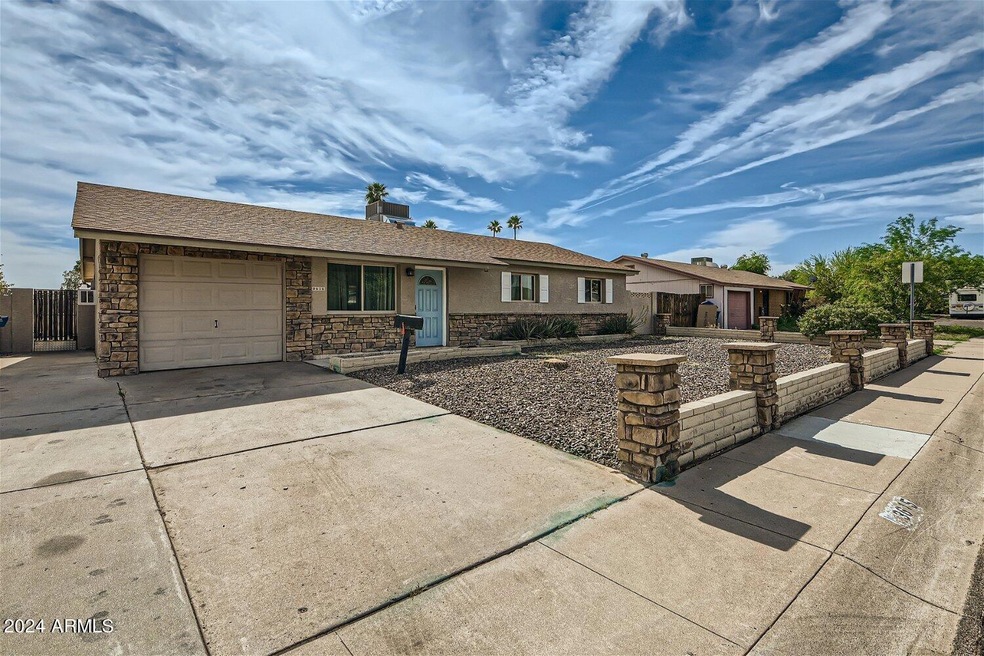
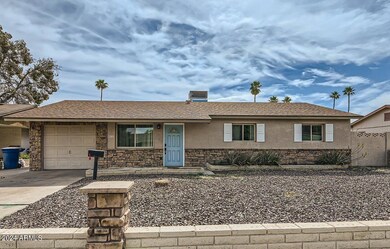
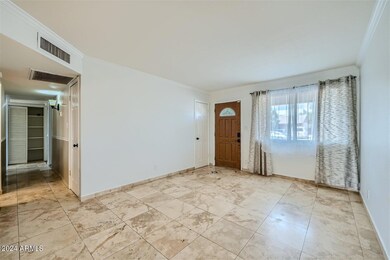
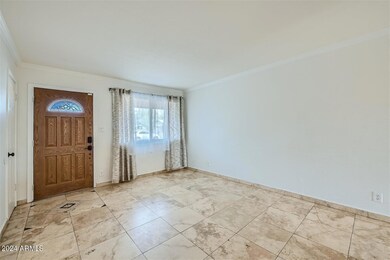
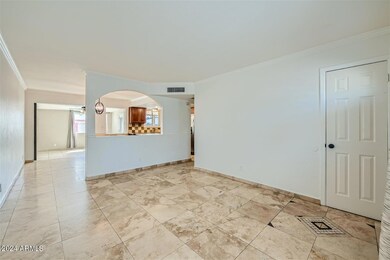
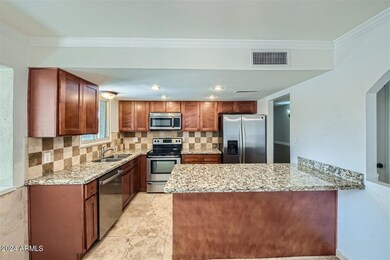
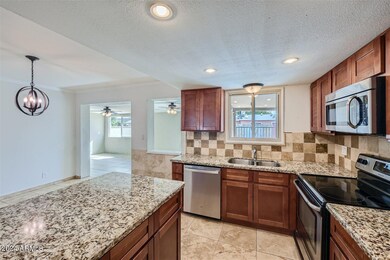
Good central location. 2-3 miles to ASU, downtown Tempe, waterfront, and all the fun Tempe events. Easy access to 4 major freeways and airport. Swimming pool with an outside bathroom, just in time for summer! Travertine tile throughout. Upgraded dual pane windows and newer AC for cost effective utilities. Open floor plan. Two living rooms. Updated kitchen. Turf and easy desert landscaping. RV gate. No HOA. Perfect for investment! Inside laundry and garage
Last Agent to Sell the Property
My Home Group Real Estate License #SA570053000 Listed on: 04/17/2024
| Date | Buyer | Sale Price | Title Company |
|---|---|---|---|
| Chung Nathanael | $475,000 | Pioneer Title Agency | |
| Chung Nathanael | $475,000 | Pioneer Title Agency | |
| Bubak Chris D | -- | None Available | |
| Bubak Chris D | $236,500 | Pioneer Title Agency Inc | |
| Love Pamela F | $165,000 | Equity Title Agency Inc | |
| Sirrine Re Llc | -- | None Available | |
| Brad Young Pllc | $100,000 | Driggs Title Agency Inc | |
| Cipolla Jack T | $210,000 | Security Title Agency | |
| Salihovic Fahrudin | -- | First American Title Ins Co | |
| Salihovic Fahrudin | $135,000 | Chicago Title Insurance Co | |
| Breen Mark A | -- | Stewart Title & Trust |
| Date | Status | Borrower | Loan Amount |
|---|---|---|---|
| Closed | Chung Nathanael | $18,366 | |
| Open | Chung Nathanael | $459,146 | |
| Closed | Chung Nathanael | $459,146 | |
| Previous Owner | Bubak Chris D | $212,850 | |
| Previous Owner | Love Pamela F | $132,000 | |
| Previous Owner | Cipolla Jack T | $206,755 | |
| Previous Owner | Salihovic Fahrudin | $134,400 | |
| Previous Owner | Salihovic Fahrudin | $132,914 | |
| Previous Owner | Breen Mark A | $77,000 |
| Date | Event | Price | List to Sale | Price per Sq Ft | Prior Sale |
|---|---|---|---|---|---|
| 06/10/2024 06/10/24 | Sold | $475,000 | 0.0% | $308 / Sq Ft | |
| 04/19/2024 04/19/24 | For Sale | $475,000 | +100.8% | $308 / Sq Ft | |
| 02/01/2017 02/01/17 | Sold | $236,500 | +3.1% | $153 / Sq Ft | View Prior Sale |
| 01/12/2017 01/12/17 | Pending | -- | -- | -- | |
| 01/08/2017 01/08/17 | For Sale | $229,500 | +39.1% | $149 / Sq Ft | |
| 03/29/2013 03/29/13 | Sold | $165,000 | -8.3% | $107 / Sq Ft | View Prior Sale |
| 02/20/2013 02/20/13 | Pending | -- | -- | -- | |
| 02/01/2013 02/01/13 | Price Changed | $179,900 | -2.7% | $117 / Sq Ft | |
| 01/25/2013 01/25/13 | Price Changed | $184,900 | -0.5% | $120 / Sq Ft | |
| 01/16/2013 01/16/13 | Price Changed | $185,900 | -1.6% | $120 / Sq Ft | |
| 01/09/2013 01/09/13 | Price Changed | $188,900 | -0.5% | $122 / Sq Ft | |
| 12/22/2012 12/22/12 | For Sale | $189,900 | +89.9% | $123 / Sq Ft | |
| 10/15/2012 10/15/12 | Sold | $100,000 | 0.0% | $65 / Sq Ft | View Prior Sale |
| 04/01/2012 04/01/12 | Pending | -- | -- | -- | |
| 03/28/2012 03/28/12 | Pending | -- | -- | -- | |
| 03/27/2012 03/27/12 | For Sale | $100,000 | 0.0% | $65 / Sq Ft | |
| 03/27/2012 03/27/12 | Price Changed | $100,000 | -9.0% | $65 / Sq Ft | |
| 03/01/2012 03/01/12 | For Sale | $109,900 | 0.0% | $71 / Sq Ft | |
| 03/01/2012 03/01/12 | Price Changed | $109,900 | 0.0% | $71 / Sq Ft | |
| 01/04/2012 01/04/12 | Pending | -- | -- | -- | |
| 10/19/2011 10/19/11 | Price Changed | $109,900 | -8.3% | $71 / Sq Ft | |
| 09/20/2011 09/20/11 | Price Changed | $119,900 | -7.7% | $78 / Sq Ft | |
| 09/02/2011 09/02/11 | Price Changed | $129,900 | -6.9% | $84 / Sq Ft | |
| 08/20/2011 08/20/11 | For Sale | $139,500 | -- | $90 / Sq Ft |
| Year | Tax Paid | Tax Assessment Tax Assessment Total Assessment is a certain percentage of the fair market value that is determined by local assessors to be the total taxable value of land and additions on the property. | Land | Improvement |
|---|---|---|---|---|
| 2025 | $1,387 | $13,307 | -- | -- |
| 2024 | $1,473 | $12,673 | -- | -- |
| 2023 | $1,473 | $29,360 | $5,870 | $23,490 |
| 2022 | $1,413 | $21,980 | $4,390 | $17,590 |
| 2021 | $1,422 | $20,030 | $4,000 | $16,030 |
| 2020 | $1,379 | $17,970 | $3,590 | $14,380 |
| 2019 | $1,353 | $16,680 | $3,330 | $13,350 |
| 2018 | $1,319 | $14,950 | $2,990 | $11,960 |
| 2017 | $1,280 | $13,470 | $2,690 | $10,780 |
| 2016 | $1,103 | $12,500 | $2,500 | $10,000 |
| 2015 | $1,067 | $11,660 | $2,330 | $9,330 |
Seller's Agent in 2024
Hilary Sutter
My Home Group
(480) 201-2963
6 in this area
170 Total Sales
C
Seller Co-Listing Agent in 2024
Cassie Rhodes
My Home Group
(480) 685-2760
5 in this area
137 Total Sales
Buyer's Agent in 2024
Tonya Nord
AZ Equity Properties
(480) 399-2974
1 in this area
22 Total Sales
S
Seller's Agent in 2017
Steven Connor
Realty One Group
B
Seller's Agent in 2013
Brad Young
Better Choice Homes, LLC
(480) 455-9867
23 Total Sales
Seller's Agent in 2012
Phil Tibi
Compass
(602) 320-1000
86 Total Sales
Source: Arizona Regional Multiple Listing Service (ARMLS)
MLS Number: 6694129
APN: 123-42-128
Disclaimer: Certain information contained herein is derived from information provided by parties other than Homes.com. All information provided is deemed reliable, but is not guaranteed to be accurate and should be independently verified.
![]() All information should be verified by the recipient and none is guaranteed as accurate by ARMLS
All information should be verified by the recipient and none is guaranteed as accurate by ARMLS
Listing Information presented by local MLS brokerage: Ten-X, local REALTOR®- Arlene Richardson - (888)-952-6393
Ask me questions while you tour the home.