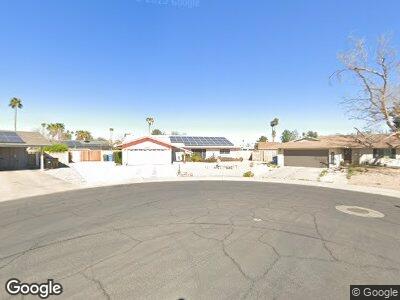
3618 W Crocus Dr Phoenix, AZ 85053
Deer Valley NeighborhoodEstimated Value: $348,950 - $479,000
--
Bed
2
Baths
1,908
Sq Ft
$230/Sq Ft
Est. Value
About This Home
This home is located at 3618 W Crocus Dr, Phoenix, AZ 85053 and is currently estimated at $438,238, approximately $229 per square foot. 3618 W Crocus Dr is a home located in Maricopa County with nearby schools including Ironwood Elementary School, Desert Foothills Middle School, and Greenway High School.
Ownership History
Date
Name
Owned For
Owner Type
Purchase Details
Closed on
Dec 19, 2018
Sold by
Lee Ian C F
Bought by
Martin Deborah
Current Estimated Value
Purchase Details
Closed on
Jan 30, 2014
Sold by
Smith Dorse Rae
Bought by
Smith Dorse R
Purchase Details
Closed on
Apr 22, 2004
Sold by
Smith Dorse R and Smith Mary F
Bought by
The Smith Family Trust
Home Financials for this Owner
Home Financials are based on the most recent Mortgage that was taken out on this home.
Original Mortgage
$129,475
Interest Rate
5.5%
Mortgage Type
Credit Line Revolving
Purchase Details
Closed on
Aug 26, 1998
Sold by
Smith Dorse R and Smith Mary F
Bought by
The Smith Family Trust
Purchase Details
Closed on
Nov 16, 1993
Sold by
Smith Trust
Bought by
Francis Smith Dorse R Mary
Home Financials for this Owner
Home Financials are based on the most recent Mortgage that was taken out on this home.
Original Mortgage
$58,800
Interest Rate
6.91%
Create a Home Valuation Report for This Property
The Home Valuation Report is an in-depth analysis detailing your home's value as well as a comparison with similar homes in the area
Home Values in the Area
Average Home Value in this Area
Purchase History
| Date | Buyer | Sale Price | Title Company |
|---|---|---|---|
| Martin Deborah | -- | None Available | |
| Smith Dorse R | -- | None Available | |
| The Smith Family Trust | -- | -- | |
| The Smith Family Trust | -- | -- |
Source: Public Records
Mortgage History
| Date | Status | Borrower | Loan Amount |
|---|---|---|---|
| Previous Owner | Smith Dorse Rae | $129,475 | |
| Previous Owner | Francis Smith Dorse R Mary | $58,800 |
Source: Public Records
Tax History Compared to Growth
Tax History
| Year | Tax Paid | Tax Assessment Tax Assessment Total Assessment is a certain percentage of the fair market value that is determined by local assessors to be the total taxable value of land and additions on the property. | Land | Improvement |
|---|---|---|---|---|
| 2025 | $1,492 | $13,922 | -- | -- |
| 2024 | $1,463 | $13,259 | -- | -- |
| 2023 | $1,463 | $29,620 | $5,920 | $23,700 |
| 2022 | $1,411 | $23,000 | $4,600 | $18,400 |
| 2021 | $1,447 | $20,920 | $4,180 | $16,740 |
| 2020 | $1,408 | $19,280 | $3,850 | $15,430 |
| 2019 | $1,382 | $18,100 | $3,620 | $14,480 |
| 2018 | $1,343 | $16,750 | $3,350 | $13,400 |
| 2017 | $1,339 | $14,250 | $2,850 | $11,400 |
| 2016 | $1,315 | $13,600 | $2,720 | $10,880 |
| 2015 | $1,220 | $12,810 | $2,560 | $10,250 |
Source: Public Records
Map
Nearby Homes
- 14408 N 35th Ave
- 3754 W Hearn Rd
- 3425 W Acoma Dr
- 3743 W Dailey St
- 14801 N 39th Ave
- 3447 W Dailey St
- 13801 N 37th Dr
- 3837 W Dailey St
- 3411 W Redfield Rd
- 3719 W Thunderbird Rd
- 3802 W Rue de Lamour Ave
- 14017 N 40th Ave
- 15031 N 37th Ave
- 3953 W Evans Dr
- 3973 W Hearn Rd
- 3828 W Port au Prince Ln
- 13834 N 39th Ln
- 14627 N 33rd Ave
- 15028 N 35th Ave
- 15212 N 37th Ave
- 3618 W Crocus Dr
- 3612 W Crocus Dr
- 3619 W Gelding Dr
- 3624 W Crocus Dr
- 3613 W Gelding Dr
- 14208 N 36th Ave
- 3625 W Gelding Dr
- 3607 W Gelding Dr
- 3619 W Crocus Dr
- 14214 N 36th Ave
- 3630 W Crocus Dr
- 14202 N 36th Ave
- 3625 W Crocus Dr
- 3631 W Gelding Dr
- 3601 W Gelding Dr Unit 8
- 3631 W Crocus Dr
- 14050 N 36th Ave
- 3618 W Gelding Dr
- 3612 W Gelding Dr
- 3637 W Gelding Dr