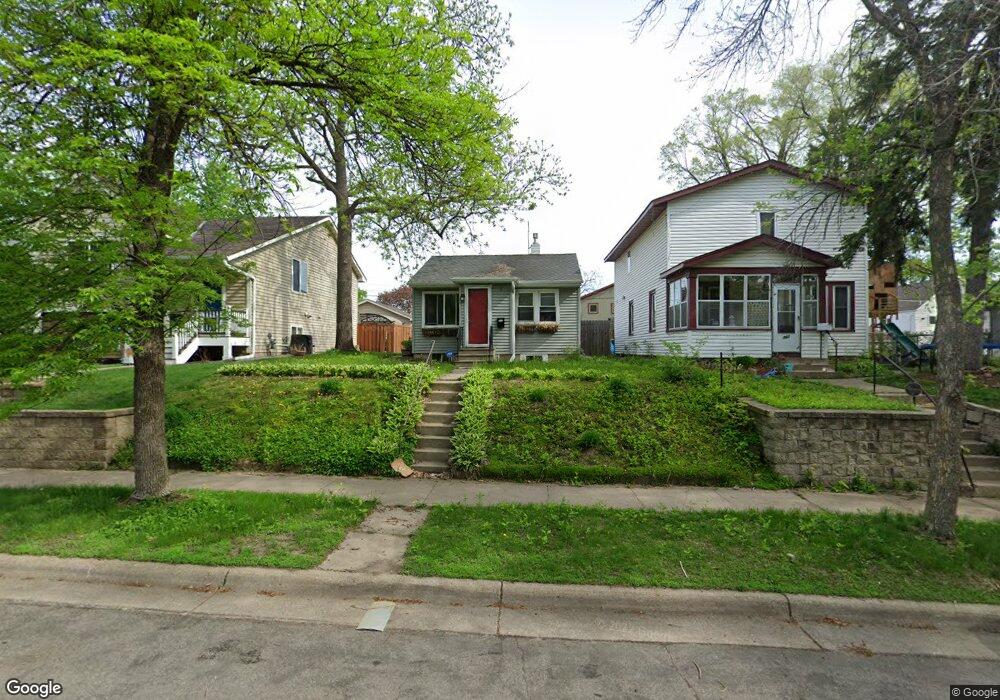
363 Sidney St E Saint Paul, MN 55107
West Side NeighborhoodEstimated Value: $195,000 - $251,000
2
Beds
1
Bath
440
Sq Ft
$484/Sq Ft
Est. Value
About This Home
This home is located at 363 Sidney St E, Saint Paul, MN 55107 and is currently estimated at $212,935, approximately $483 per square foot. 363 Sidney St E is a home located in Ramsey County with nearby schools including Cherokee Heights Elementary School, Humboldt Secondary School, and Quantum STEAM Academy.
Ownership History
Date
Name
Owned For
Owner Type
Purchase Details
Closed on
Jun 22, 2017
Sold by
Iverson Casie Jo and Iverson Amy Christlne
Bought by
Schauer Carrissa A
Current Estimated Value
Home Financials for this Owner
Home Financials are based on the most recent Mortgage that was taken out on this home.
Original Mortgage
$122,407
Interest Rate
3.96%
Mortgage Type
New Conventional
Purchase Details
Closed on
Jan 23, 2015
Sold by
Iverson Cassie Joe and Iverson Amy Christine
Bought by
Iverson Cassie Jo and Iverson Amy Christine
Purchase Details
Closed on
Aug 22, 2014
Sold by
Stickler Katherine and Stickler Anthony
Bought by
Iverson Cassie J
Home Financials for this Owner
Home Financials are based on the most recent Mortgage that was taken out on this home.
Original Mortgage
$58,000
Interest Rate
4.1%
Create a Home Valuation Report for This Property
The Home Valuation Report is an in-depth analysis detailing your home's value as well as a comparison with similar homes in the area
Home Values in the Area
Average Home Value in this Area
Purchase History
| Date | Buyer | Sale Price | Title Company |
|---|---|---|---|
| Schauer Carrissa A | $132,755 | Community Title & Escrow | |
| Iverson Cassie Jo | $515 | None Available | |
| Iverson Cassie J | $59,757 | Executive Title Services | |
| Iverson Cassie Cassie | $58,000 | -- |
Source: Public Records
Mortgage History
| Date | Status | Borrower | Loan Amount |
|---|---|---|---|
| Previous Owner | Schauer Carrissa A | $122,407 | |
| Previous Owner | Iverson Cassie Cassie | $58,000 | |
| Previous Owner | Iverson Cassie J | $76,783 |
Source: Public Records
Tax History
| Year | Tax Paid | Tax Assessment Tax Assessment Total Assessment is a certain percentage of the fair market value that is determined by local assessors to be the total taxable value of land and additions on the property. | Land | Improvement |
|---|---|---|---|---|
| 2025 | $2,682 | $217,800 | $22,800 | $195,000 |
| 2023 | $2,682 | $188,200 | $17,600 | $170,600 |
| 2022 | $2,518 | $186,300 | $17,600 | $168,700 |
| 2021 | $1,958 | $173,800 | $17,600 | $156,200 |
| 2020 | $1,826 | $145,000 | $17,600 | $127,400 |
| 2019 | $1,654 | $129,700 | $17,600 | $112,100 |
| 2018 | $1,434 | $118,200 | $17,600 | $100,600 |
| 2017 | $1,138 | $102,200 | $17,600 | $84,600 |
| 2016 | $1,180 | $0 | $0 | $0 |
| 2015 | $820 | $79,600 | $17,600 | $62,000 |
| 2014 | $1,104 | $0 | $0 | $0 |
Source: Public Records
Map
Nearby Homes
- 344 Page St E
- 309 Sidney St E
- 302 Sidney St E
- 468 Curtice St E
- 277 Morton St E
- 474 Curtice St E
- 303 Cesar Chavez St
- 510 Wyoming St E
- 188 Wyoming St E
- 657 Oakdale Ave
- 181 Annapolis St E
- 604 Oakdale Ave
- 568 State St Unit C
- 534 Annapolis St
- 755 Robert St S
- 235 Mainzer St
- 954 Oakdale Ave
- 655 Robert St S
- 147 Hurley St E
- 66 Stevens St E
- 367 Sidney St E
- 367 367 Sidney-Street-e
- 367 367 Sidney St E
- 359 Sidney St E
- 359 359 Sidney-Street-e
- 355 Sidney St E
- 355 Sidney St E
- 373 373 Sidney St E
- 373 Sidney St E
- 349 Sidney St E
- 355 355 Sidney-Street-e
- 360 Page St E
- 360 360 Page St E
- 368 Page St E
- 379 379 Sidney St E
- 379 Sidney St E
- 372 Page St E
- 352 Page St E
- 364 Sidney St E
- 376 Page St E
Your Personal Tour Guide
Ask me questions while you tour the home.