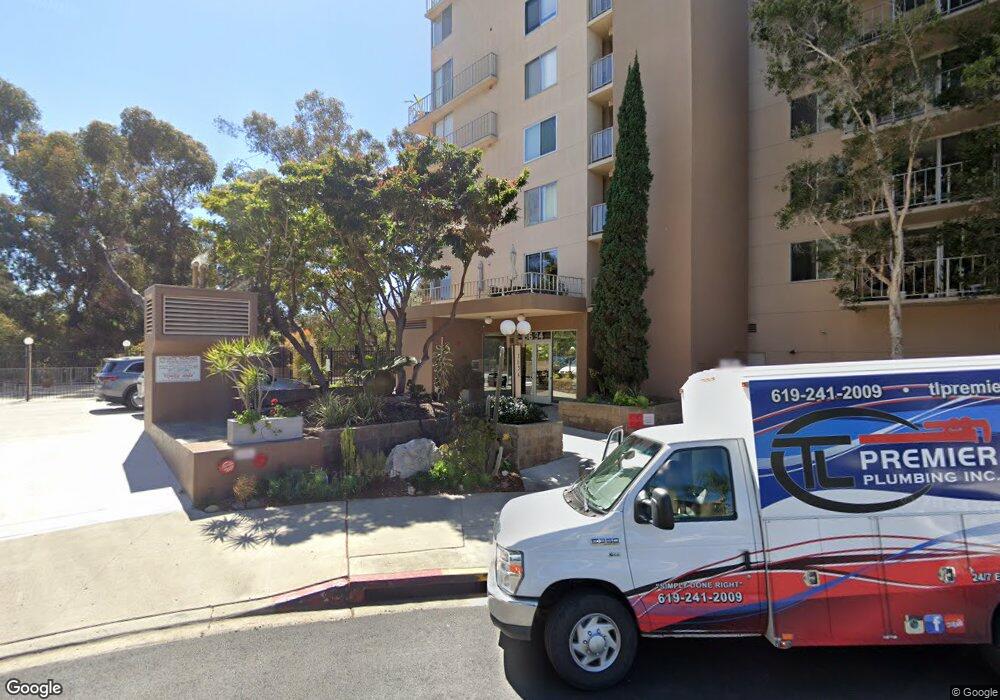
Coral Tree Plaza 3634 7th Ave Unit 1B San Diego, CA 92103
Hillcrest NeighborhoodEstimated Value: $581,463 - $659,000
1
Bed
1
Bath
805
Sq Ft
$767/Sq Ft
Est. Value
About This Home
This home is located at 3634 7th Ave Unit 1B, San Diego, CA 92103 and is currently estimated at $617,616, approximately $767 per square foot. 3634 7th Ave Unit 1B is a home located in San Diego County with nearby schools including Florence Elementary School, Roosevelt International Middle School, and Museum School.
Ownership History
Date
Name
Owned For
Owner Type
Purchase Details
Closed on
Oct 19, 2012
Sold by
Castella Virginia C
Bought by
Castella Virginia C and Cepin Sandra Maria
Current Estimated Value
Home Financials for this Owner
Home Financials are based on the most recent Mortgage that was taken out on this home.
Original Mortgage
$145,000
Outstanding Balance
$63,227
Interest Rate
3.5%
Mortgage Type
New Conventional
Estimated Equity
$554,389
Purchase Details
Closed on
Sep 25, 2012
Sold by
Forsyth Lococo Mary Jean and Jaros Ellen Rene
Bought by
Castella Virginia C
Home Financials for this Owner
Home Financials are based on the most recent Mortgage that was taken out on this home.
Original Mortgage
$145,000
Outstanding Balance
$63,227
Interest Rate
3.5%
Mortgage Type
New Conventional
Estimated Equity
$554,389
Purchase Details
Closed on
Jun 24, 2010
Sold by
Lococo Virginia M
Bought by
Lococo Virginia M and Forsyth Mary Jean
Purchase Details
Closed on
Oct 6, 1998
Sold by
Stokes Patty C
Bought by
Lococo Virginia M
Create a Home Valuation Report for This Property
The Home Valuation Report is an in-depth analysis detailing your home's value as well as a comparison with similar homes in the area
Home Values in the Area
Average Home Value in this Area
Purchase History
| Date | Buyer | Sale Price | Title Company |
|---|---|---|---|
| Castella Virginia C | -- | None Available | |
| Castella Virginia C | $290,000 | Equity Title | |
| Lococo Virginia M | -- | None Available | |
| Lococo Virginia M | $135,000 | Benefit Land Title Company |
Source: Public Records
Mortgage History
| Date | Status | Borrower | Loan Amount |
|---|---|---|---|
| Open | Castella Virginia C | $145,000 |
Source: Public Records
Tax History Compared to Growth
Tax History
| Year | Tax Paid | Tax Assessment Tax Assessment Total Assessment is a certain percentage of the fair market value that is determined by local assessors to be the total taxable value of land and additions on the property. | Land | Improvement |
|---|---|---|---|---|
| 2025 | $4,245 | $357,103 | $110,821 | $246,282 |
| 2024 | $4,245 | $350,102 | $108,649 | $241,453 |
| 2023 | $4,150 | $343,238 | $106,519 | $236,719 |
| 2022 | $4,038 | $336,509 | $104,431 | $232,078 |
| 2021 | $4,009 | $329,912 | $102,384 | $227,528 |
| 2020 | $3,960 | $326,530 | $101,335 | $225,195 |
| 2019 | $3,888 | $320,129 | $99,349 | $220,780 |
| 2018 | $3,634 | $313,852 | $97,401 | $216,451 |
| 2017 | $80 | $307,699 | $95,492 | $212,207 |
| 2016 | $3,488 | $301,667 | $93,620 | $208,047 |
| 2015 | $3,436 | $297,136 | $92,214 | $204,922 |
| 2014 | $3,381 | $291,316 | $90,408 | $200,908 |
Source: Public Records
About Coral Tree Plaza
Map
Nearby Homes
- 3634 7th Ave Unit 4B
- 3635 7th Ave Unit 6C
- 3635 7th Ave Unit 15G
- 3635 7th Ave Unit 13E
- 3634 7th Ave Unit 1B
- 3635 7th Ave Unit 9E
- 3709 7th Ave Unit 6
- 3650 5th Ave Unit 415
- 3650 5th Ave Unit 404
- 3687 4th Ave Unit 315
- 3415 6th Ave Unit 14
- 3740 5th Ave
- 3565 3rd Ave
- 3774 5th Ave Unit 7-10
- 1032 Pennsylvania Ave
- 1034 Pennsylvania Ave
- 140 Walnut Ave Unit 2A
- 3290 6th Ave Unit 3B
- 3740 3rd Ave Unit 4
- 3285 5th Ave
- 3635 7th Ave
- 3634 7th Ave
- 3635 7th Ave Unit 10BC
- 3634 7th Ave Unit 11bc
- 3634 7th Ave Unit 12A
- 3634 7th Ave Unit 7BC
- 3634 7th Ave Unit 8D
- 3635 7th Ave Unit 7E
- 3635 7th Ave Unit 6D
- 3634 7th Ave Unit 12E
- 3634 7th Ave Unit 12A
- 3634 7th Ave Unit 11D
- 3634 7th Ave Unit 11E
- 3634 7th Ave Unit 11B
- 3634 7th Ave Unit 11A
- 3634 7th Ave Unit 10D
- 3634 7th Ave Unit 10E
- 3634 7th Ave Unit 10BC
- 3634 7th Ave Unit 10A
- 3634 7th Ave Unit 9D