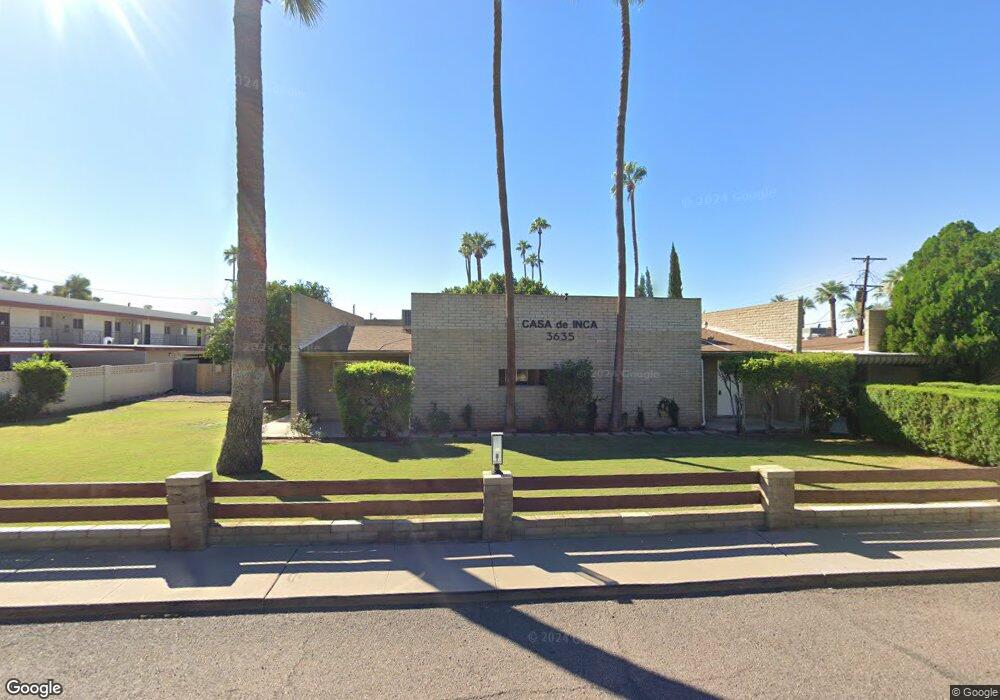
3635 E Turney Ave Phoenix, AZ 85018
Camelback East Village NeighborhoodEstimated Value: $282,669 - $351,000
1
Bed
1
Bath
816
Sq Ft
$390/Sq Ft
Est. Value
About This Home
This home is located at 3635 E Turney Ave, Phoenix, AZ 85018 and is currently estimated at $318,417, approximately $390 per square foot. 3635 E Turney Ave is a home located in Maricopa County with nearby schools including Biltmore Preparatory Academy, Camelback High School, and Phoenix Coding Academy.
Ownership History
Date
Name
Owned For
Owner Type
Purchase Details
Closed on
Feb 5, 2019
Sold by
Wilson Doug
Bought by
Gavelda Mark
Current Estimated Value
Home Financials for this Owner
Home Financials are based on the most recent Mortgage that was taken out on this home.
Original Mortgage
$180,000
Outstanding Balance
$157,930
Interest Rate
4.4%
Mortgage Type
New Conventional
Estimated Equity
$160,487
Purchase Details
Closed on
Oct 19, 2018
Sold by
Lindsay William Blair
Bought by
Wilson Doug
Purchase Details
Closed on
May 12, 2016
Sold by
Wasserbaech Ralph
Bought by
Lindsay William Blair
Home Financials for this Owner
Home Financials are based on the most recent Mortgage that was taken out on this home.
Original Mortgage
$76,000
Interest Rate
3.71%
Mortgage Type
New Conventional
Purchase Details
Closed on
Apr 21, 2014
Sold by
Stair Gaven K and Stair Donna D
Bought by
Wasserbaech Dieter and Wasserbaech Ralph
Create a Home Valuation Report for This Property
The Home Valuation Report is an in-depth analysis detailing your home's value as well as a comparison with similar homes in the area
Home Values in the Area
Average Home Value in this Area
Purchase History
| Date | Buyer | Sale Price | Title Company |
|---|---|---|---|
| Gavelda Mark | $200,000 | Great American Title Agency | |
| Wilson Doug | $137,500 | Driggs Title Agency Inc | |
| Lindsay William Blair | $95,000 | Fidelity Natl Title Agency I | |
| Wasserbaech Dieter | $77,500 | Grand Canyon Title Agency In |
Source: Public Records
Mortgage History
| Date | Status | Borrower | Loan Amount |
|---|---|---|---|
| Open | Gavelda Mark | $180,000 | |
| Previous Owner | Lindsay William Blair | $76,000 |
Source: Public Records
Tax History
| Year | Tax Paid | Tax Assessment Tax Assessment Total Assessment is a certain percentage of the fair market value that is determined by local assessors to be the total taxable value of land and additions on the property. | Land | Improvement |
|---|---|---|---|---|
| 2025 | $607 | $5,080 | -- | -- |
| 2024 | $576 | $4,838 | -- | -- |
| 2023 | $576 | $22,680 | $4,530 | $18,150 |
| 2022 | $552 | $17,160 | $3,430 | $13,730 |
| 2021 | $573 | $14,610 | $2,920 | $11,690 |
| 2020 | $558 | $13,170 | $2,630 | $10,540 |
| 2019 | $555 | $10,510 | $2,100 | $8,410 |
| 2018 | $543 | $9,470 | $1,890 | $7,580 |
| 2017 | $520 | $8,110 | $1,620 | $6,490 |
| 2016 | $499 | $7,300 | $1,460 | $5,840 |
| 2015 | $524 | $5,870 | $1,170 | $4,700 |
Source: Public Records
Map
Nearby Homes
- 3650 E Montecito Ave Unit 4
- 3635 E Turney Ave Unit 12
- 3737 E Turney Ave Unit 206
- 3737 E Turney Ave Unit 120
- 3737 E Turney Ave Unit 226
- 3618 E Montecito Ave
- 3736 E Montecito Ave
- 3738 E Montecito Ave
- 3715 E Glenrosa Ave
- 4408 N 37th Way
- 3713 E Glenrosa Ave
- 4416 N 37th Way
- 4246 N 36th St Unit 99
- 3715 E Sells Dr
- 4203 N 36th St Unit 11
- 4206 N 38th St Unit 4
- 4206 N 38th St Unit 6
- 3702 E Monterosa St Unit 6
- 4144 N 36th St
- 4394 N 36th St Unit 33
- 3635 E Turney Ave
- 3635 E Turney Ave Unit 15
- 3635 E Turney Ave Unit 1
- 3635 E Turney Ave Unit 1
- 3635 E Turney Ave Unit 18
- 3635 E Turney Ave Unit 18
- 3635 E Turney Ave Unit 18
- 3635 E Turney Ave Unit 18
- 3635 E Turney Ave Unit 18
- 3635 E Turney Ave Unit 18
- 3635 E Turney Ave Unit 18
- 3635 E Turney Ave Unit 14
- 3635 E Turney Ave Unit 3
- 3635 E Turney Ave Unit 13
- 3635 E Turney Ave Unit 11
- 3635 E Turney Ave
- 3635 E Turney Ave Unit 9
- 3635 E Turney Ave Unit 6
- 3635 E Turney Ave Unit 10
- 3635 E Turney Ave Unit 16
Your Personal Tour Guide
Ask me questions while you tour the home.