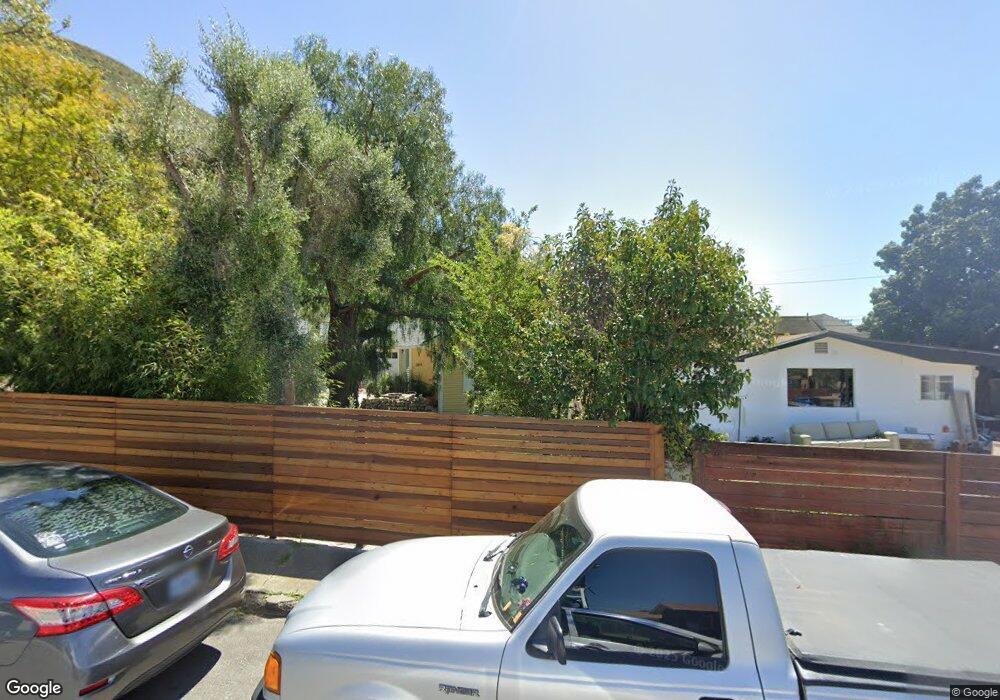
364 E Mcfarlane St Ventura, CA 93001
Westside NeighborhoodEstimated Value: $673,119 - $775,000
2
Beds
1
Bath
787
Sq Ft
$927/Sq Ft
Est. Value
About This Home
This home is located at 364 E Mcfarlane St, Ventura, CA 93001 and is currently estimated at $729,780, approximately $927 per square foot. 364 E Mcfarlane St is a home located in Ventura County with nearby schools including E.P. Foster Elementary School, De Anza Academy Of Technology And The Arts, and Ventura High School.
Ownership History
Date
Name
Owned For
Owner Type
Purchase Details
Closed on
Apr 3, 1998
Sold by
Winger Kevin R
Bought by
Laughlin David F
Current Estimated Value
Home Financials for this Owner
Home Financials are based on the most recent Mortgage that was taken out on this home.
Original Mortgage
$57,000
Outstanding Balance
$10,896
Interest Rate
7.18%
Mortgage Type
Purchase Money Mortgage
Estimated Equity
$718,884
Purchase Details
Closed on
Feb 10, 1997
Sold by
Charbonneau Antoinette D
Bought by
Winger Kevin R and Laughlin David F
Home Financials for this Owner
Home Financials are based on the most recent Mortgage that was taken out on this home.
Original Mortgage
$55,250
Interest Rate
7.75%
Mortgage Type
Purchase Money Mortgage
Purchase Details
Closed on
Feb 5, 1997
Sold by
Charbonneau Eugene E and Charbonneau Robert E
Bought by
Charbonneau Antoinette D
Home Financials for this Owner
Home Financials are based on the most recent Mortgage that was taken out on this home.
Original Mortgage
$55,250
Interest Rate
7.75%
Mortgage Type
Purchase Money Mortgage
Purchase Details
Closed on
Jul 22, 1996
Sold by
Four Cs
Bought by
Charbonneau Eugene E and Charbonneau Antoinette D
Create a Home Valuation Report for This Property
The Home Valuation Report is an in-depth analysis detailing your home's value as well as a comparison with similar homes in the area
Home Values in the Area
Average Home Value in this Area
Purchase History
| Date | Buyer | Sale Price | Title Company |
|---|---|---|---|
| Laughlin David F | $28,500 | Fidelity National Title Co | |
| Winger Kevin R | $65,000 | Chicago Title Co | |
| Charbonneau Antoinette D | -- | -- | |
| Charbonneau Eugene E | -- | -- |
Source: Public Records
Mortgage History
| Date | Status | Borrower | Loan Amount |
|---|---|---|---|
| Open | Laughlin David F | $57,000 | |
| Previous Owner | Winger Kevin R | $55,250 |
Source: Public Records
Tax History
| Year | Tax Paid | Tax Assessment Tax Assessment Total Assessment is a certain percentage of the fair market value that is determined by local assessors to be the total taxable value of land and additions on the property. | Land | Improvement |
|---|---|---|---|---|
| 2025 | $3,216 | $294,736 | $108,724 | $186,012 |
| 2024 | $3,216 | $288,957 | $106,592 | $182,365 |
| 2023 | $3,176 | $283,292 | $104,502 | $178,790 |
| 2022 | $2,963 | $277,738 | $102,453 | $175,285 |
| 2021 | $2,906 | $272,293 | $100,444 | $171,849 |
| 2020 | $2,879 | $269,503 | $99,415 | $170,088 |
| 2019 | $2,327 | $216,319 | $97,466 | $118,853 |
| 2018 | $1,478 | $134,480 | $95,552 | $38,928 |
| 2017 | $1,447 | $131,844 | $93,679 | $38,165 |
| 2016 | $1,420 | $129,260 | $91,843 | $37,417 |
| 2015 | $1,405 | $127,320 | $90,464 | $36,856 |
| 2014 | $1,383 | $124,828 | $88,693 | $36,135 |
Source: Public Records
Map
Nearby Homes
- 1400 Cameron St
- 103 Comstock Dr
- 90 Leighton Dr
- 154 El Medio St
- 121 E Warner St
- 212 E Barnett St
- 2277 Cayuse Ln
- 108 Barry Dr
- 852 N Ventura Ave
- 2349 Aztec Ave
- 2350 Hopi Ln
- 614 Cedar St
- 2389 N Ventura Ave
- 557 561 N North Olive St
- 911 Vallecito Dr
- 531 Cedar St
- 176 W Ramona St
- 2672 Cedar St
- 2687 Cedar St
- 310 N Kalorama St
- 354 E Mcfarlane St
- 354 E Mcfarlane Dr
- 367 Leighton Dr
- 344 E Mcfarlane St
- 357 Leighton Dr
- 363 E Mcfarlane Dr
- 363 E Mcfarlane St
- 375 E Mcfarlane St
- 347 Leighton Dr
- 353 E Mcfarlane St
- 353 E Mcfarlane Dr
- 332 E Mcfarlane St
- 345 E Mcfarlane St
- 337 Leighton Dr
- 322 E Mcfarlane St
- 333 E Mcfarlane St
- 333 Leighton Dr
- 362 -364 Comstock Dr
- 362 Comstock Dr Unit 364
- 362 Comstock Dr
Your Personal Tour Guide
Ask me questions while you tour the home.