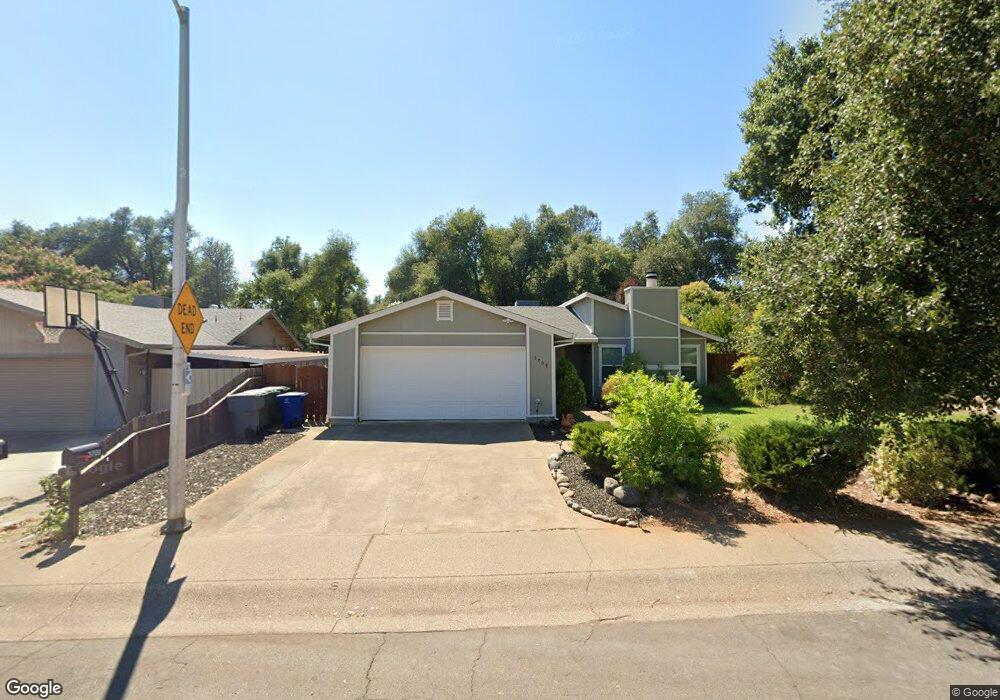
3708 Harrow Ct Redding, CA 96002
Enterprise NeighborhoodEstimated Value: $315,000 - $340,000
3
Beds
2
Baths
1,386
Sq Ft
$239/Sq Ft
Est. Value
About This Home
This home is located at 3708 Harrow Ct, Redding, CA 96002 and is currently estimated at $330,933, approximately $238 per square foot. 3708 Harrow Ct is a home located in Shasta County with nearby schools including Lassen View Elementary School, Parsons Junior High School, and Enterprise High School.
Ownership History
Date
Name
Owned For
Owner Type
Purchase Details
Closed on
May 14, 2025
Sold by
Rorie Andrea D
Bought by
Andrea Rorie Family Trust and Rorie
Current Estimated Value
Purchase Details
Closed on
Jul 27, 2010
Sold by
Reynolds Michael
Bought by
Rorie Andrea D
Home Financials for this Owner
Home Financials are based on the most recent Mortgage that was taken out on this home.
Original Mortgage
$156,887
Interest Rate
4.71%
Mortgage Type
FHA
Purchase Details
Closed on
Sep 7, 2006
Sold by
Miller Charles Everett and Miller Eileen
Bought by
Reynolds Michael
Purchase Details
Closed on
Aug 4, 2006
Sold by
Miller Charles Everett and Miller Eileen
Bought by
Miller Charles Everett and Miller Eileen
Purchase Details
Closed on
Mar 7, 2005
Sold by
Miller Charles E and Miller Eileen
Bought by
Miller Charles Everett and Miller Eileen
Create a Home Valuation Report for This Property
The Home Valuation Report is an in-depth analysis detailing your home's value as well as a comparison with similar homes in the area
Home Values in the Area
Average Home Value in this Area
Purchase History
| Date | Buyer | Sale Price | Title Company |
|---|---|---|---|
| Andrea Rorie Family Trust | -- | None Listed On Document | |
| Rorie Andrea D | $159,000 | Fidelity Natl Title Co Of Ca | |
| Reynolds Michael | $240,000 | Placer Title Company | |
| Miller Charles Everett | -- | None Available | |
| Miller Charles Everett | -- | -- |
Source: Public Records
Mortgage History
| Date | Status | Borrower | Loan Amount |
|---|---|---|---|
| Previous Owner | Rorie Andrea D | $156,887 |
Source: Public Records
Tax History Compared to Growth
Tax History
| Year | Tax Paid | Tax Assessment Tax Assessment Total Assessment is a certain percentage of the fair market value that is determined by local assessors to be the total taxable value of land and additions on the property. | Land | Improvement |
|---|---|---|---|---|
| 2025 | $2,149 | $203,693 | $51,240 | $152,453 |
| 2024 | $2,118 | $199,700 | $50,236 | $149,464 |
| 2023 | $2,118 | $195,785 | $49,251 | $146,534 |
| 2022 | $2,056 | $191,947 | $48,286 | $143,661 |
| 2021 | $1,985 | $188,185 | $47,340 | $140,845 |
| 2020 | $1,975 | $186,256 | $46,855 | $139,401 |
| 2019 | $1,958 | $182,605 | $45,937 | $136,668 |
| 2018 | $1,934 | $179,026 | $45,037 | $133,989 |
| 2017 | $1,966 | $175,516 | $44,154 | $131,362 |
| 2016 | $1,838 | $172,076 | $43,289 | $128,787 |
| 2015 | $1,822 | $169,492 | $42,639 | $126,853 |
| 2014 | $1,808 | $166,173 | $41,804 | $124,369 |
Source: Public Records
Map
Nearby Homes
- 3703 Harrow Ct
- 1153 Ruthie Ln
- 1201 Echo Rd
- 3710 Indio Way
- 3628 Somerset Ave
- 3591 Adams Ln
- 953 Camino Ct
- 1198 Denton Way
- 952 Camino Ct
- 3306 Lawrence Rd
- 3527 Adams Ln
- 855 Jefferson Ct
- 1091 Del Sol Place
- 3293 Middleton Ln
- 3475 Oak Haven Ct
- 3428 Adams Ln
- 3178 Lawrence Rd
- 3283 Middleton Ln
- 3540 Ricardo Ave
- 3897 Sunwood Dr
- 3720 Harrow Ct
- 1300 Harpole Rd Unit CLEAN!
- 1300 Harpole Rd
- 1291 Harpole Rd
- 1322 Harpole Rd
- 1274 Harpole Rd
- 3715 Harrow Ct
- 3715 Harrow Ct (4%)
- 3744 Harrow Ct
- 1354 Harpole Rd
- 3727 Harrow Ct
- 1279 Harpole Rd
- 1262 Harpole Rd
- 1331 Harpole Rd Unit A
- 1331 Harpole Rd
- 3756 Harrow Ct
- 3739 Harrow Ct
- 3640 Alma Ave
- 3652 Alma Ave
- 1405 Harpole Rd