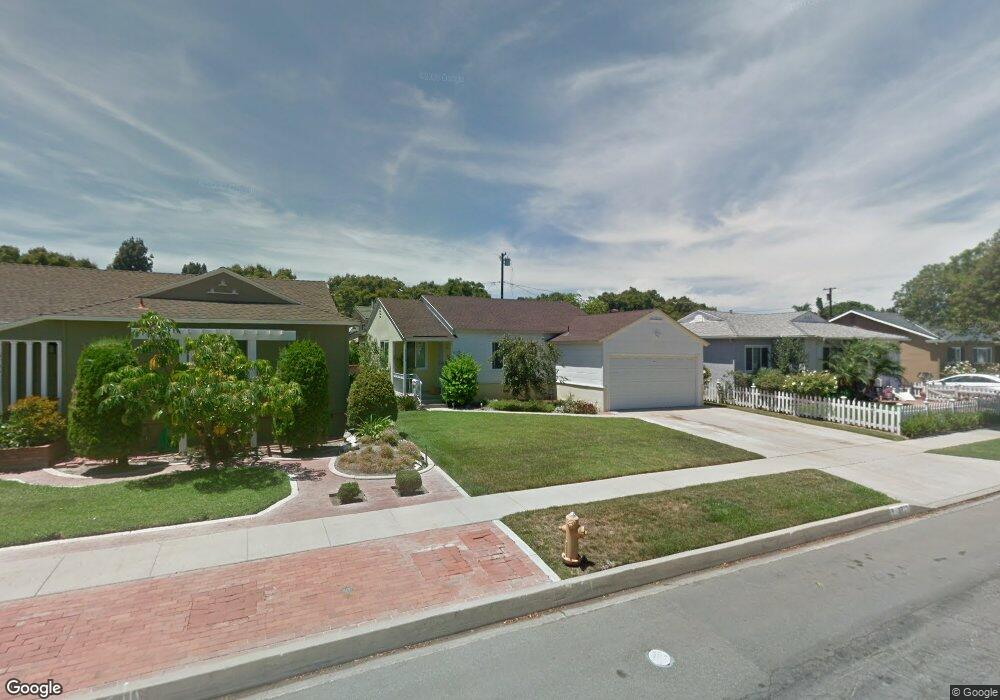
3713 Nipomo Ave Long Beach, CA 90808
Plaza NeighborhoodEstimated Value: $836,695 - $979,000
2
Beds
1
Bath
887
Sq Ft
$1,006/Sq Ft
Est. Value
About This Home
This home is located at 3713 Nipomo Ave, Long Beach, CA 90808 and is currently estimated at $892,674, approximately $1,006 per square foot. 3713 Nipomo Ave is a home located in Los Angeles County with nearby schools including Cubberley K-8, Millikan High School, and St. Maria Goretti Catholic School.
Ownership History
Date
Name
Owned For
Owner Type
Purchase Details
Closed on
Jun 16, 2020
Sold by
Meyer Stephanie
Bought by
Meyer Stephanie and The Stephanie Meyer Trust
Current Estimated Value
Home Financials for this Owner
Home Financials are based on the most recent Mortgage that was taken out on this home.
Original Mortgage
$294,000
Outstanding Balance
$206,680
Interest Rate
3.2%
Mortgage Type
New Conventional
Estimated Equity
$685,994
Purchase Details
Closed on
Feb 9, 2018
Sold by
Meyer Stephanie
Bought by
Meyer Stephanie and Stephanie Meyer Trust
Purchase Details
Closed on
Aug 1, 2011
Sold by
Garrett Jack L and The Jack L Garrett Revocable T
Bought by
Meyer Stephanie
Home Financials for this Owner
Home Financials are based on the most recent Mortgage that was taken out on this home.
Original Mortgage
$335,279
Interest Rate
4.4%
Mortgage Type
FHA
Purchase Details
Closed on
Mar 4, 2002
Sold by
Garrett Jack L
Bought by
The Jack L Garrett Revocable Trust
Create a Home Valuation Report for This Property
The Home Valuation Report is an in-depth analysis detailing your home's value as well as a comparison with similar homes in the area
Home Values in the Area
Average Home Value in this Area
Purchase History
| Date | Buyer | Sale Price | Title Company |
|---|---|---|---|
| Meyer Stephanie | -- | Progressive Title Co Inc | |
| Meyer Stephanie | -- | Progressive Title Co Inc | |
| Meyer Stephanie | -- | None Available | |
| Meyer Stephanie | $344,000 | Pacific Coast Title Company | |
| The Jack L Garrett Revocable Trust | -- | -- |
Source: Public Records
Mortgage History
| Date | Status | Borrower | Loan Amount |
|---|---|---|---|
| Open | Meyer Stephanie | $294,000 | |
| Closed | Meyer Stephanie | $335,279 |
Source: Public Records
Tax History Compared to Growth
Tax History
| Year | Tax Paid | Tax Assessment Tax Assessment Total Assessment is a certain percentage of the fair market value that is determined by local assessors to be the total taxable value of land and additions on the property. | Land | Improvement |
|---|---|---|---|---|
| 2025 | $5,511 | $432,069 | $345,659 | $86,410 |
| 2024 | $5,511 | $423,598 | $338,882 | $84,716 |
| 2023 | $5,418 | $415,293 | $332,238 | $83,055 |
| 2022 | $5,084 | $407,151 | $325,724 | $81,427 |
| 2021 | $4,984 | $399,169 | $319,338 | $79,831 |
| 2019 | $4,909 | $387,331 | $309,867 | $77,464 |
| 2018 | $4,730 | $379,738 | $303,792 | $75,946 |
| 2016 | $4,348 | $364,995 | $291,997 | $72,998 |
| 2015 | $4,172 | $359,513 | $287,611 | $71,902 |
| 2014 | $4,143 | $352,472 | $281,978 | $70,494 |
Source: Public Records
Map
Nearby Homes
- 3602 Nipomo Ave
- 6557 E Walkerton St
- 6829 E Parapet St
- 6923 E Keynote St
- 3903 N Studebaker Rd
- 6447 E Harco St
- 3839 Lees Ave
- 3471 Knoxville Ave
- 3523 Kallin Ave
- 3568 Roxanne Ave
- 3635 Conquista Ave
- 3828 Volk Ave
- 3350 N Studebaker Rd
- 3816 Snowden Ave
- 4103 Palo Verde Ave
- 7165 E Wardlow Rd
- 3304 Roxanne Ave
- 4217 Monogram Ave
- 3333 N Los Coyotes Diagonal
- 3518 Faust Ave
- 3719 Nipomo Ave
- 3709 Nipomo Ave
- 3718 Monogram Ave
- 3723 Nipomo Ave
- 3703 Nipomo Ave
- 3722 Monogram Ave
- 3712 Monogram Ave
- 3728 Monogram Ave
- 3708 Monogram Ave
- 3712 Nipomo Ave
- 3729 Nipomo Ave
- 3651 Nipomo Ave
- 3716 Nipomo Ave
- 3708 Nipomo Ave
- 3722 Nipomo Ave
- 3734 Monogram Ave
- 3702 Monogram Ave
- 3702 Nipomo Ave
- 3645 Nipomo Ave
- 3735 Nipomo Ave