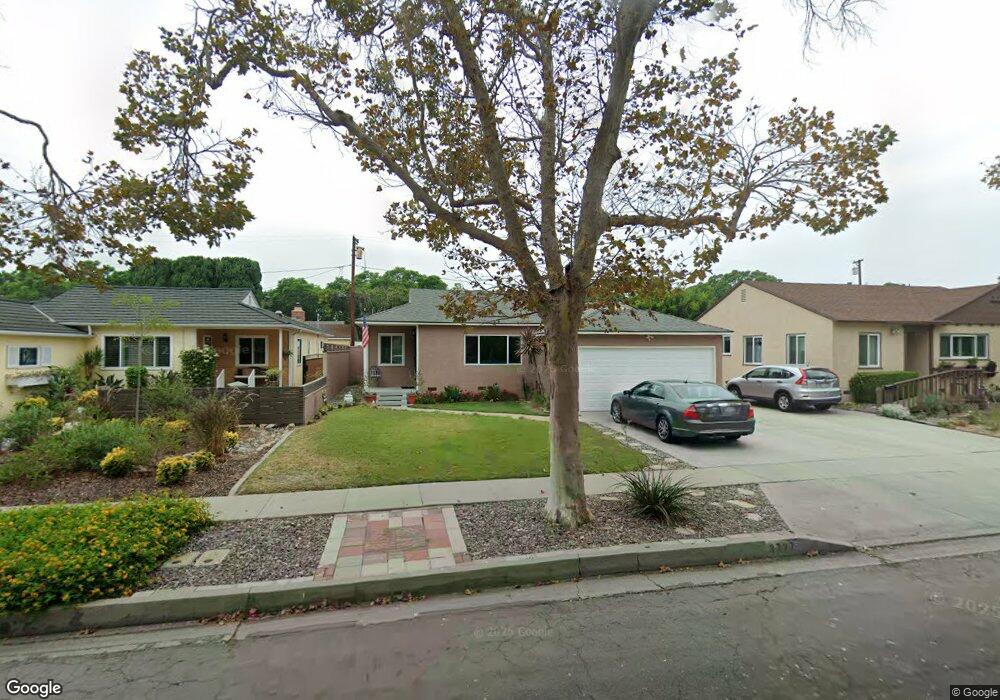
3727 N Studebaker Rd Long Beach, CA 90808
Plaza NeighborhoodEstimated Value: $863,169 - $972,000
2
Beds
2
Baths
1,091
Sq Ft
$860/Sq Ft
Est. Value
About This Home
This home is located at 3727 N Studebaker Rd, Long Beach, CA 90808 and is currently estimated at $938,792, approximately $860 per square foot. 3727 N Studebaker Rd is a home located in Los Angeles County with nearby schools including Cubberley K-8, Millikan High School, and St. Maria Goretti Catholic School.
Ownership History
Date
Name
Owned For
Owner Type
Purchase Details
Closed on
Jan 30, 2009
Sold by
Baker Michael Earl and Baker Julie Irene
Bought by
Baker Michael Earl
Current Estimated Value
Home Financials for this Owner
Home Financials are based on the most recent Mortgage that was taken out on this home.
Original Mortgage
$348,000
Interest Rate
5.01%
Mortgage Type
New Conventional
Purchase Details
Closed on
Jan 9, 2008
Sold by
Baker Michael Earl and Baker Julie Irene
Bought by
Baker Michael Earl
Home Financials for this Owner
Home Financials are based on the most recent Mortgage that was taken out on this home.
Original Mortgage
$340,000
Interest Rate
5.85%
Mortgage Type
New Conventional
Purchase Details
Closed on
Jun 2, 2005
Sold by
Baker Michael Earl and Baker Julie Irene
Bought by
Baker Michael Earl
Create a Home Valuation Report for This Property
The Home Valuation Report is an in-depth analysis detailing your home's value as well as a comparison with similar homes in the area
Home Values in the Area
Average Home Value in this Area
Purchase History
| Date | Buyer | Sale Price | Title Company |
|---|---|---|---|
| Baker Michael Earl | -- | Chicago Title Company | |
| Baker Michael Earl | -- | None Available | |
| Baker Michael Earl | -- | Chicago Title Co | |
| Baker Michael Earl | -- | -- | |
| Baker Michael Earl | -- | -- |
Source: Public Records
Mortgage History
| Date | Status | Borrower | Loan Amount |
|---|---|---|---|
| Closed | Baker Michael Earl | $348,000 | |
| Closed | Baker Michael Earl | $340,000 |
Source: Public Records
Tax History
| Year | Tax Paid | Tax Assessment Tax Assessment Total Assessment is a certain percentage of the fair market value that is determined by local assessors to be the total taxable value of land and additions on the property. | Land | Improvement |
|---|---|---|---|---|
| 2025 | $2,892 | $211,320 | $128,421 | $82,899 |
| 2024 | $2,892 | $207,177 | $125,903 | $81,274 |
| 2023 | $2,840 | $203,116 | $123,435 | $79,681 |
| 2022 | $2,670 | $199,134 | $121,015 | $78,119 |
| 2021 | $2,610 | $195,231 | $118,643 | $76,588 |
| 2019 | $2,570 | $189,442 | $115,125 | $74,317 |
| 2018 | $2,441 | $185,728 | $112,868 | $72,860 |
| 2016 | $2,240 | $178,518 | $108,486 | $70,032 |
| 2015 | $2,154 | $175,838 | $106,857 | $68,981 |
| 2014 | $2,143 | $172,394 | $104,764 | $67,630 |
Source: Public Records
Map
Nearby Homes
- 3702 N Studebaker Rd
- 3903 N Studebaker Rd
- 6829 E Parapet St
- 3502 Monogram Ave
- 3516 Roxanne Ave
- 3973 Knoxville Ave
- 3509 Volk Ave
- 3426 Roxanne Ave
- 3675 Palo Verde Ave
- 6721 E Coralite St
- 3635 Conquista Ave
- 3458 Stevely Ave
- 7020 Schroll St
- 7080 Schroll St
- 4151 Los Coyotes Diagonal
- 3816 Snowden Ave
- 6128 E Conant St
- 4256 Quigley Ave
- 3738 Gondar Ave
- 3202 N Studebaker Rd
- 3733 N Studebaker Rd
- 3723 N Studebaker Rd
- 3726 Petaluma Ave
- 3739 N Studebaker Rd
- 3717 N Studebaker Rd
- 3732 Petaluma Ave
- 3722 Petaluma Ave
- 3736 Petaluma Ave
- 3716 Petaluma Ave
- 3713 N Studebaker Rd
- 3742 Petaluma Ave
- 3712 Petaluma Ave
- 3749 N Studebaker Rd
- 3707 N Studebaker Rd
- 3748 Petaluma Ave
- 3706 Petaluma Ave
- 3729 Petaluma Ave
- 3755 N Studebaker Rd
- 3723 Petaluma Ave
- 3733 Petaluma Ave
Your Personal Tour Guide
Ask me questions while you tour the home.