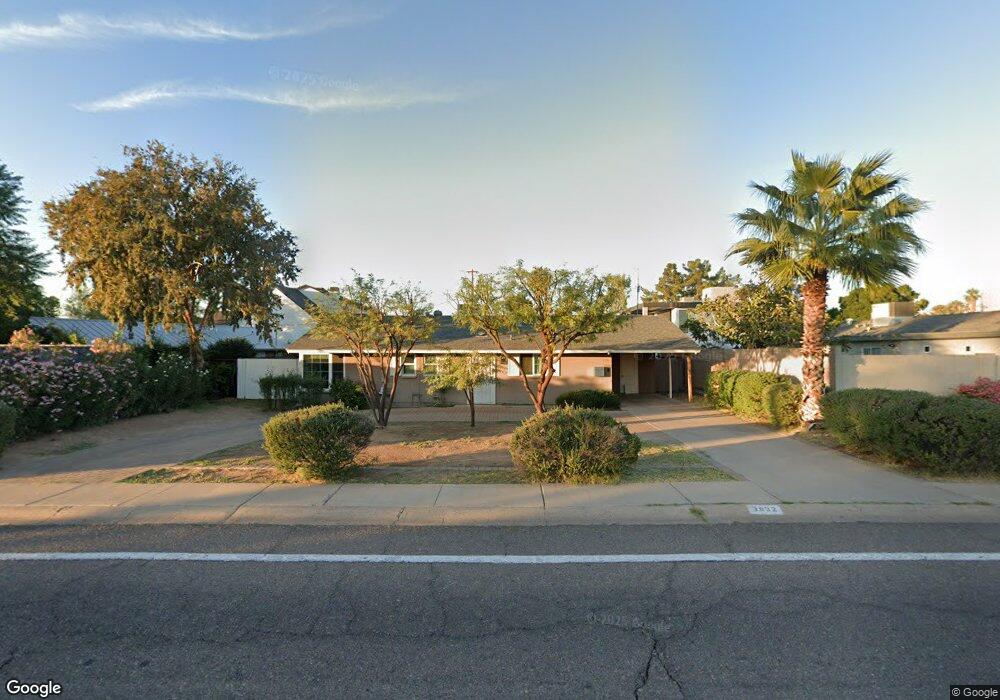
3832 E Campbell Ave Unit 4 Phoenix, AZ 85018
Camelback East Village NeighborhoodEstimated Value: $692,000 - $910,000
3
Beds
2
Baths
1,200
Sq Ft
$675/Sq Ft
Est. Value
About This Home
This home is located at 3832 E Campbell Ave Unit 4, Phoenix, AZ 85018 and is currently estimated at $809,599, approximately $674 per square foot. 3832 E Campbell Ave Unit 4 is a home located in Maricopa County with nearby schools including Biltmore Preparatory Academy, Camelback High School, and Phoenix Coding Academy.
Ownership History
Date
Name
Owned For
Owner Type
Purchase Details
Closed on
Jan 17, 2019
Sold by
Jacobson Jillana
Bought by
Jacobson Jillana and The Jillana Jacobson Living Tr
Current Estimated Value
Purchase Details
Closed on
May 12, 2011
Sold by
Elusion Homes Llc
Bought by
Jacobson Jillana
Home Financials for this Owner
Home Financials are based on the most recent Mortgage that was taken out on this home.
Original Mortgage
$194,750
Outstanding Balance
$134,127
Interest Rate
4.84%
Mortgage Type
New Conventional
Estimated Equity
$675,472
Purchase Details
Closed on
Dec 2, 2010
Sold by
Alvarez Annette Y
Bought by
Elusion Homes Llc
Purchase Details
Closed on
Aug 1, 2000
Sold by
Shannon Mathew E and Shannon Karen Jo
Bought by
Alvarez Annette Y
Home Financials for this Owner
Home Financials are based on the most recent Mortgage that was taken out on this home.
Original Mortgage
$123,446
Interest Rate
8.16%
Mortgage Type
FHA
Create a Home Valuation Report for This Property
The Home Valuation Report is an in-depth analysis detailing your home's value as well as a comparison with similar homes in the area
Home Values in the Area
Average Home Value in this Area
Purchase History
| Date | Buyer | Sale Price | Title Company |
|---|---|---|---|
| Jacobson Jillana | -- | None Available | |
| Jacobson Jillana | $205,000 | Old Republic Title Agency | |
| Elusion Homes Llc | $157,200 | Fidelity National Title | |
| Alvarez Annette Y | $123,635 | Chicago Title Insurance Co |
Source: Public Records
Mortgage History
| Date | Status | Borrower | Loan Amount |
|---|---|---|---|
| Open | Jacobson Jillana | $194,750 | |
| Previous Owner | Alvarez Annette Y | $123,446 |
Source: Public Records
Tax History
| Year | Tax Paid | Tax Assessment Tax Assessment Total Assessment is a certain percentage of the fair market value that is determined by local assessors to be the total taxable value of land and additions on the property. | Land | Improvement |
|---|---|---|---|---|
| 2025 | $3,243 | $27,148 | -- | -- |
| 2024 | $3,081 | $25,856 | -- | -- |
| 2023 | $3,081 | $55,560 | $11,110 | $44,450 |
| 2022 | $2,950 | $40,980 | $8,190 | $32,790 |
| 2021 | $3,060 | $38,150 | $7,630 | $30,520 |
| 2020 | $2,981 | $35,030 | $7,000 | $28,030 |
| 2019 | $2,964 | $32,020 | $6,400 | $25,620 |
| 2018 | $2,900 | $30,250 | $6,050 | $24,200 |
| 2017 | $2,781 | $28,260 | $5,650 | $22,610 |
| 2016 | $2,667 | $25,930 | $5,180 | $20,750 |
| 2015 | $2,486 | $23,120 | $4,620 | $18,500 |
Source: Public Records
Map
Nearby Homes
- 4512 N 38th St
- 4416 N 37th Way
- 4525 N 40th St
- 4525 N 40th St Unit 7
- 4620 N 40th St
- 4408 N 37th Way
- 3715 E Sells Dr
- 4610 N 40th St
- 3738 E Montecito Ave
- 3901 E Highland Ave
- 4021 E Hazelwood St
- 3736 E Montecito Ave
- 4037 E Minnezona Ave
- 3737 E Turney Ave Unit 206
- 3737 E Turney Ave Unit 120
- 3737 E Turney Ave Unit 226
- 3635 E Turney Ave Unit 12
- 4411 N 40th St Unit 51
- 3650 E Montecito Ave Unit 4
- 4010 E Coolidge St
- 3824 E Campbell Ave
- 3838 E Campbell Ave
- 4512 N 39th St
- 4517 N 38th Place
- 3827 E Campbell Ave
- 4518 N 39th St
- 3835 E Campbell Ave
- 3902 E Campbell Ave
- 3821 E Campbell Ave
- 3810 E Campbell Ave
- 4510 N 38th Place
- 4523 N 38th Place
- 4511 N 39th St
- 3815 E Campbell Ave
- 4526 N 39th St
- 4516 N 38th Place
- 3901 E Campbell Ave
- 4517 N 39th St
- 3910 E Campbell Ave
- 4527 N 38th Place
Your Personal Tour Guide
Ask me questions while you tour the home.