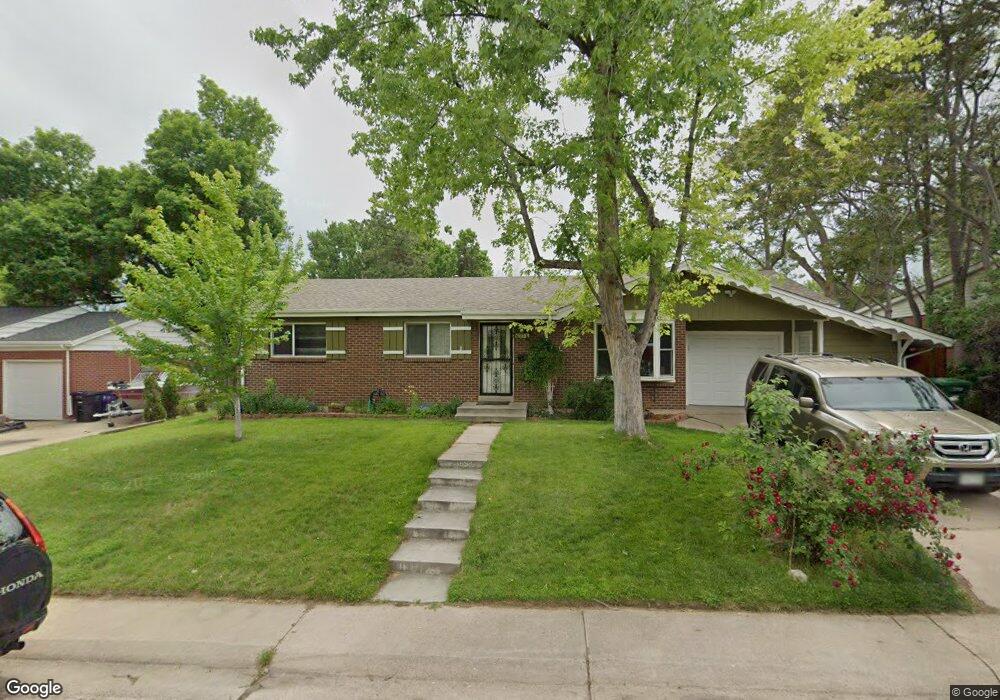
3958 W Chenango Ave Littleton, CO 80123
Fort Logan NeighborhoodEstimated Value: $512,854 - $568,000
3
Beds
1
Bath
2,184
Sq Ft
$247/Sq Ft
Est. Value
About This Home
This home is located at 3958 W Chenango Ave, Littleton, CO 80123 and is currently estimated at $539,714, approximately $247 per square foot. 3958 W Chenango Ave is a home located in Denver County with nearby schools including Kaiser Elementary School, Bear Valley International School, and John F Kennedy High School.
Ownership History
Date
Name
Owned For
Owner Type
Purchase Details
Closed on
Jul 23, 2009
Sold by
Secretary Of Housing & Urban Development
Bought by
Cochran William R
Current Estimated Value
Purchase Details
Closed on
Mar 19, 2009
Sold by
Zaburskiy Stanislav and Zaburskaya Olga
Bought by
The Secretary Of Housing & Urban Develop
Purchase Details
Closed on
Sep 26, 2002
Sold by
Campbell Alvin M and Campbell Rosemarie
Bought by
Zaburskiy Stanislav and Zaburskaya Olga
Home Financials for this Owner
Home Financials are based on the most recent Mortgage that was taken out on this home.
Original Mortgage
$192,241
Interest Rate
6.09%
Mortgage Type
FHA
Create a Home Valuation Report for This Property
The Home Valuation Report is an in-depth analysis detailing your home's value as well as a comparison with similar homes in the area
Home Values in the Area
Average Home Value in this Area
Purchase History
| Date | Buyer | Sale Price | Title Company |
|---|---|---|---|
| Cochran William R | $150,411 | Wtg | |
| The Secretary Of Housing & Urban Develop | $178,734 | None Available | |
| Zaburskiy Stanislav | $195,000 | -- |
Source: Public Records
Mortgage History
| Date | Status | Borrower | Loan Amount |
|---|---|---|---|
| Previous Owner | Zaburskiy Stanislav | $192,241 |
Source: Public Records
Tax History Compared to Growth
Tax History
| Year | Tax Paid | Tax Assessment Tax Assessment Total Assessment is a certain percentage of the fair market value that is determined by local assessors to be the total taxable value of land and additions on the property. | Land | Improvement |
|---|---|---|---|---|
| 2024 | $2,728 | $33,450 | $4,650 | $28,800 |
| 2023 | $2,671 | $33,450 | $4,650 | $28,800 |
| 2022 | $2,107 | $25,570 | $8,650 | $16,920 |
| 2021 | $2,032 | $26,290 | $8,890 | $17,400 |
| 2020 | $1,907 | $24,740 | $8,220 | $16,520 |
| 2019 | $1,843 | $24,740 | $8,220 | $16,520 |
| 2018 | $1,656 | $20,830 | $6,210 | $14,620 |
| 2017 | $1,649 | $20,830 | $6,210 | $14,620 |
| 2016 | $1,535 | $18,310 | $6,862 | $11,448 |
| 2015 | $1,469 | $18,310 | $6,862 | $11,448 |
| 2014 | $1,174 | $13,720 | $3,980 | $9,740 |
Source: Public Records
Map
Nearby Homes
- 3999 W Chenango Ave
- 3928 W Chenango Ave
- 4090 W Wagon Trail Dr
- 4244 W Monmouth Ave
- 3742 W Union Ave
- 5095 S Osceola St
- 3630 W Saratoga Ave
- 3397 W Tanforan Dr
- 3963 W Temple Place
- 4621 S Perry Way
- 3713 W Union Ave
- 5067 S Mabre Ct
- 3379 W Wagon Trail Dr
- 3659 W Union Ave Unit F4
- 4621 S Lowell Blvd Unit J6
- 3590 W Pimlico Ave
- 4643 S Lowell Blvd Unit B
- 4665 S Raleigh St
- 5134 S Perry St
- 4201 W Tufts Ave
- 3938 W Chenango Ave
- 3978 W Chenango Ave
- 4017 W Grand Ave
- 3997 W Grand Ave
- 3998 W Chenango Ave
- 3979 W Chenango Ave
- 3959 W Chenango Ave
- 3939 W Chenango Ave
- 3977 W Grand Ave
- 4097 W Grand Ave
- 3919 W Chenango Ave
- 3918 W Chenango Ave
- 3957 W Grand Ave
- 3899 W Chenango Ave
- 3840 W Saratoga Ave
- 4016 W Grand Ave
- 4038 W Chenango Ave
- 4036 W Grand Ave
- 3996 W Grand Ave
- 3850 W Saratoga Ave