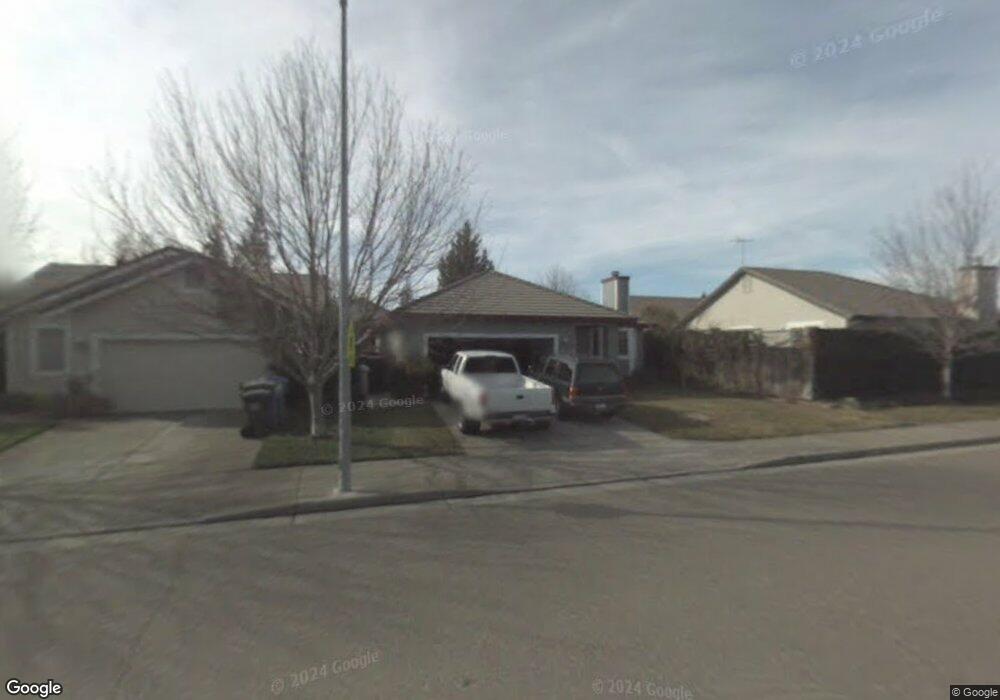
397 Sugar Maple Ln Windsor, CA 95492
Estimated Value: $623,000 - $719,000
3
Beds
2
Baths
1,230
Sq Ft
$557/Sq Ft
Est. Value
About This Home
This home is located at 397 Sugar Maple Ln, Windsor, CA 95492 and is currently estimated at $684,906, approximately $556 per square foot. 397 Sugar Maple Ln is a home located in Sonoma County with nearby schools including Mattie Washburn Elementary School, Brooks Elementary School, and Windsor Middle School.
Ownership History
Date
Name
Owned For
Owner Type
Purchase Details
Closed on
Jan 27, 2021
Sold by
Combes Carl Q
Bought by
Combes Carl Q
Current Estimated Value
Home Financials for this Owner
Home Financials are based on the most recent Mortgage that was taken out on this home.
Original Mortgage
$370,200
Outstanding Balance
$330,931
Interest Rate
2.67%
Mortgage Type
New Conventional
Estimated Equity
$353,975
Purchase Details
Closed on
Jun 29, 2017
Sold by
Combes Adrienne
Bought by
Combes Carl Q
Home Financials for this Owner
Home Financials are based on the most recent Mortgage that was taken out on this home.
Original Mortgage
$385,500
Interest Rate
3.95%
Mortgage Type
New Conventional
Purchase Details
Closed on
Aug 12, 1994
Sold by
Calprop Corp
Bought by
Combes Carl Q and Combes Adrienne
Home Financials for this Owner
Home Financials are based on the most recent Mortgage that was taken out on this home.
Original Mortgage
$152,761
Interest Rate
8.73%
Mortgage Type
FHA
Create a Home Valuation Report for This Property
The Home Valuation Report is an in-depth analysis detailing your home's value as well as a comparison with similar homes in the area
Home Values in the Area
Average Home Value in this Area
Purchase History
| Date | Buyer | Sale Price | Title Company |
|---|---|---|---|
| Combes Carl Q | -- | Fidelity National Title Co | |
| Combes Carl Q | -- | First American Title Company | |
| Combes Carl Q | $157,500 | North American Title Company |
Source: Public Records
Mortgage History
| Date | Status | Borrower | Loan Amount |
|---|---|---|---|
| Open | Combes Carl Q | $370,200 | |
| Closed | Combes Carl Q | $385,500 | |
| Closed | Combes Carl Q | $152,761 |
Source: Public Records
Tax History
| Year | Tax Paid | Tax Assessment Tax Assessment Total Assessment is a certain percentage of the fair market value that is determined by local assessors to be the total taxable value of land and additions on the property. | Land | Improvement |
|---|---|---|---|---|
| 2025 | $3,288 | $264,572 | $117,735 | $146,837 |
| 2024 | $3,288 | $259,385 | $115,427 | $143,958 |
| 2023 | $3,288 | $254,300 | $113,164 | $141,136 |
| 2022 | $3,175 | $249,315 | $110,946 | $138,369 |
| 2021 | $3,125 | $244,427 | $108,771 | $135,656 |
| 2020 | $3,189 | $241,922 | $107,656 | $134,266 |
| 2019 | $3,183 | $237,180 | $105,546 | $131,634 |
| 2018 | $3,138 | $232,530 | $103,477 | $129,053 |
| 2017 | $3,110 | $227,972 | $101,449 | $126,523 |
| 2016 | $2,923 | $223,503 | $99,460 | $124,043 |
| 2015 | $2,847 | $220,147 | $97,967 | $122,180 |
| 2014 | $2,809 | $215,835 | $96,048 | $119,787 |
Source: Public Records
Map
Nearby Homes
- 160 Flametree Cir
- 1276 Jensen Ln Unit LOT 2
- 1276 Jensen Ln Unit LOT 1
- 1276 Jensen Ln Unit LOT 3
- 179 Pleasant Ave
- 8644 Alden Ln
- 208 Viking Ct
- 153 Bari Ln
- 203 Cockrobin Ave
- 172 Cornell St
- 152 Amanda Way
- 155 Amanda Way
- 159 Amanda Way
- 145 Amanda Way
- 149 Amanda Way
- 333 Cornell Stree
- 230 Courtyards E
- 106 Courtyards E
- 327 Blazing Star Ct
- 8109 B St
- 648 Shagbark St
- 642 Shagbark St
- 712 Hackberry Ct
- 385 Sugar Maple Ln
- 706 Hackberry Ct
- 700 Hackberry Ct
- 500 Cockspur Ct
- 718 Hackberry Ct
- 379 Sugar Maple Ln
- 402 Sugar Maple Ln
- 724 Hackberry Ct
- 506 Cockspur Ct
- 408 Sugar Maple Ln
- 501 Cockspur Ct
- 643 Shagbark St
- 637 Shagbark St
- 467 Quince St
- 463 Quince St
Your Personal Tour Guide
Ask me questions while you tour the home.