
Seller's Agent in 2021
Nikki Trocchio
Calcagni Real Estate
(203) 535-9596
14 in this area
63 Total Sales
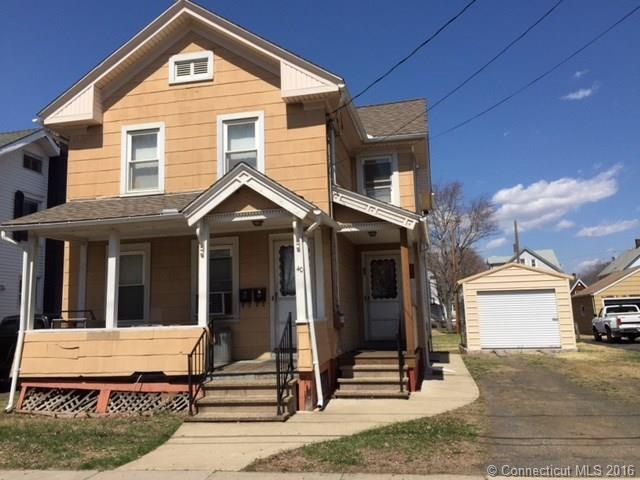
Two family home offers 2 bedrooms in each unit. Home needs work. Being sold "as is".
Last Agent to Sell the Property
Bottom Line Realty License #REB.0788206 Listed on: 04/19/2015
Home Type
Est. Annual Taxes
Year Built
Lot Details
Home Design
Interior Spaces
Parking
Outdoor Features
Schools
Utilities
Community Details
| Date | Type | Sale Price | Title Company |
|---|---|---|---|
| Warranty Deed | $335,000 | None Available | |
| Quit Claim Deed | -- | -- | |
| Quit Claim Deed | -- | -- | |
| Warranty Deed | $65,000 | -- |
| Date | Status | Loan Amount | Loan Type |
|---|---|---|---|
| Previous Owner | $189,000 | Stand Alone Refi Refinance Of Original Loan | |
| Previous Owner | $100,000 | No Value Available | |
| Previous Owner | $45,000 | No Value Available |
| Date | Event | Price | Change | Sq Ft Price |
|---|---|---|---|---|
| 11/02/2021 11/02/21 | Rented | $1,450 | 0.0% | -- |
| 10/28/2021 10/28/21 | Under Contract | -- | -- | -- |
| 10/01/2021 10/01/21 | For Rent | $1,450 | 0.0% | -- |
| 10/14/2020 10/14/20 | Sold | $335,000 | -1.2% | $195 / Sq Ft |
| 09/07/2020 09/07/20 | Pending | -- | -- | -- |
| 08/31/2020 08/31/20 | For Sale | $339,000 | 0.0% | $198 / Sq Ft |
| 04/11/2019 04/11/19 | Rented | $1,450 | +7.4% | -- |
| 03/06/2019 03/06/19 | Under Contract | -- | -- | -- |
| 02/15/2019 02/15/19 | For Rent | $1,350 | +12.5% | -- |
| 01/27/2016 01/27/16 | Rented | $1,200 | 0.0% | -- |
| 12/17/2015 12/17/15 | Under Contract | -- | -- | -- |
| 11/02/2015 11/02/15 | For Rent | $1,200 | 0.0% | -- |
| 08/27/2015 08/27/15 | Sold | $65,000 | -40.9% | $38 / Sq Ft |
| 05/21/2015 05/21/15 | Pending | -- | -- | -- |
| 04/19/2015 04/19/15 | For Sale | $109,900 | -- | $64 / Sq Ft |
| Year | Tax Paid | Tax Assessment Tax Assessment Total Assessment is a certain percentage of the fair market value that is determined by local assessors to be the total taxable value of land and additions on the property. | Land | Improvement |
|---|---|---|---|---|
| 2024 | $4,817 | $157,100 | $61,700 | $95,400 |
| 2023 | $4,609 | $157,100 | $61,700 | $95,400 |
| 2022 | $4,562 | $157,100 | $61,700 | $95,400 |
| 2021 | $4,480 | $157,100 | $61,700 | $95,400 |
| 2020 | $5,006 | $171,500 | $65,900 | $105,600 |
| 2019 | $5,006 | $171,500 | $65,900 | $105,600 |
| 2018 | $4,912 | $171,500 | $65,900 | $105,600 |
| 2017 | $4,896 | $171,500 | $65,900 | $105,600 |
| 2016 | $4,783 | $171,500 | $65,900 | $105,600 |
| 2015 | $3,566 | $129,800 | $65,900 | $63,900 |
| 2014 | $3,490 | $129,800 | $65,900 | $63,900 |
Seller's Agent in 2021
Nikki Trocchio
Calcagni Real Estate
(203) 535-9596
14 in this area
63 Total Sales
Buyer's Agent in 2021
Marcelle Sahossi
Keller Williams Prestige Prop.
(203) 327-6700
51 Total Sales
Seller's Agent in 2020
Shawn SanMiguel
Consolidated Realty Services
(203) 530-1757
1 in this area
12 Total Sales
A
Seller's Agent in 2019
Ann Marie Barros
Homestead Realty Group, LLC
(203) 537-2418
1 in this area
6 Total Sales
Seller's Agent in 2016
Frances Lyman
Bottom Line Realty
(203) 996-8729
10 in this area
37 Total Sales
Seller's Agent in 2015
Jaimie Andrews
Bottom Line Realty
(203) 214-2433
6 in this area
139 Total Sales
Source: SmartMLS
MLS Number: P10037477
APN: WALL-000133-000000-000375
Disclaimer: Certain information contained herein is derived from information provided by parties other than Homes.com. All information provided is deemed reliable, but is not guaranteed to be accurate and should be independently verified.
![]() IDX information is provided exclusively for personal, non-commercial use, and may not be used for any purpose other than to identify prospective properties consumers may be interested in purchasing. Information is deemed reliable but not guaranteed.
IDX information is provided exclusively for personal, non-commercial use, and may not be used for any purpose other than to identify prospective properties consumers may be interested in purchasing. Information is deemed reliable but not guaranteed.