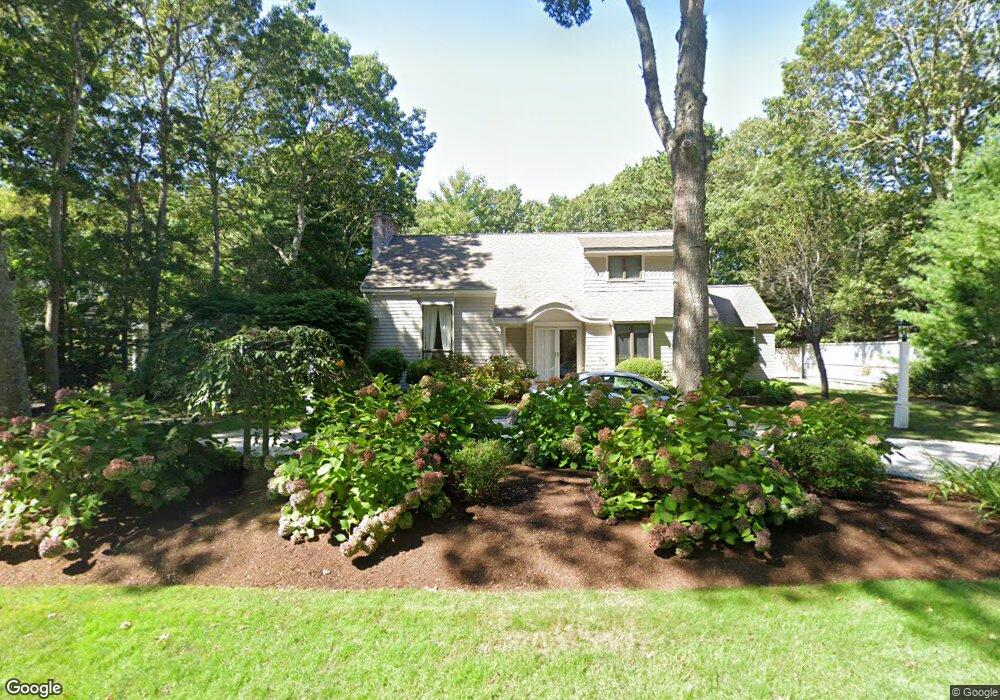
40 Topping Lift Mashpee, MA 02649
New Seabury-Popponesset Island NeighborhoodEstimated Value: $1,084,000 - $1,376,000
3
Beds
3
Baths
2,201
Sq Ft
$538/Sq Ft
Est. Value
About This Home
This home is located at 40 Topping Lift, Mashpee, MA 02649 and is currently estimated at $1,185,115, approximately $538 per square foot. 40 Topping Lift is a home located in Barnstable County with nearby schools including Kenneth C. Coombs School, Quashnet School, and Mashpee Middle School.
Ownership History
Date
Name
Owned For
Owner Type
Purchase Details
Closed on
Feb 1, 2005
Sold by
Testamentary T
Bought by
Michalowski Mark and Edgerly Peter D
Current Estimated Value
Home Financials for this Owner
Home Financials are based on the most recent Mortgage that was taken out on this home.
Original Mortgage
$385,000
Outstanding Balance
$194,659
Interest Rate
5.67%
Estimated Equity
$990,456
Create a Home Valuation Report for This Property
The Home Valuation Report is an in-depth analysis detailing your home's value as well as a comparison with similar homes in the area
Home Values in the Area
Average Home Value in this Area
Purchase History
| Date | Buyer | Sale Price | Title Company |
|---|---|---|---|
| Michalowski Mark | -- | -- |
Source: Public Records
Mortgage History
| Date | Status | Borrower | Loan Amount |
|---|---|---|---|
| Open | Michalowski Mark | $385,000 |
Source: Public Records
Tax History Compared to Growth
Tax History
| Year | Tax Paid | Tax Assessment Tax Assessment Total Assessment is a certain percentage of the fair market value that is determined by local assessors to be the total taxable value of land and additions on the property. | Land | Improvement |
|---|---|---|---|---|
| 2025 | $6,114 | $923,600 | $370,400 | $553,200 |
| 2024 | $5,601 | $871,000 | $336,800 | $534,200 |
| 2023 | $5,135 | $732,500 | $296,000 | $436,500 |
| 2022 | $4,900 | $599,800 | $240,700 | $359,100 |
| 2021 | $4,805 | $529,800 | $216,800 | $313,000 |
| 2020 | $4,833 | $531,700 | $225,900 | $305,800 |
| 2019 | $4,625 | $511,000 | $225,900 | $285,100 |
| 2018 | $4,435 | $497,200 | $225,900 | $271,300 |
| 2017 | $4,537 | $493,700 | $225,900 | $267,800 |
| 2016 | $4,394 | $475,500 | $225,900 | $249,600 |
| 2015 | $4,219 | $463,100 | $225,900 | $237,200 |
| 2014 | $4,314 | $459,400 | $222,400 | $237,000 |
Source: Public Records
Map
Nearby Homes